| << Chapter < Page | Chapter >> Page > |
An ordered pair, gives the coordinates of a point in a rectangular coordinate system.

So how do the coordinates of a point help you locate a point on the plane?
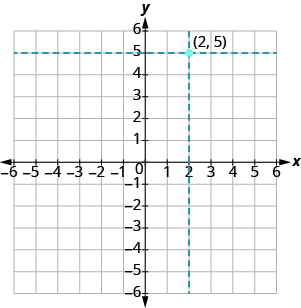
Let’s try locating the point . In this ordered pair, the -coordinate is and the -coordinate is .
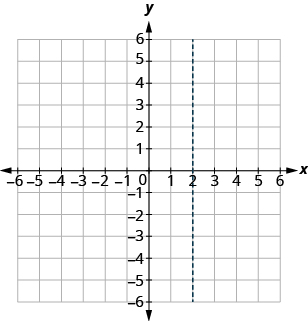
We start by locating the value, on the Then we lightly sketch a vertical line through as shown in [link] .
Now we locate the value, on the -axis and sketch a horizontal line through . The point where these two lines meet is the point with coordinates We plot the point there, as shown in [link] .
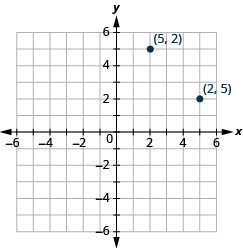
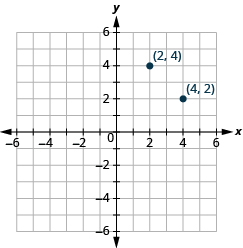
Plot and in the same rectangular coordinate system.
The coordinate values are the same for both points, but the
and
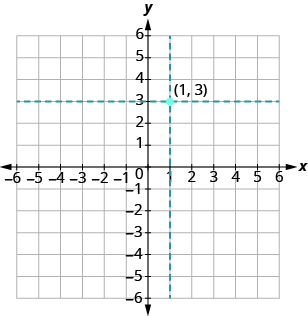
values are reversed. Let’s begin with point
The
is
so find
on the
and sketch a vertical line through
The
is
so we find
on the
and sketch a horizontal line through
Where the two lines meet, we plot the point
To plot the point
we start by locating
on the
and sketch a vertical line through
Then we find
on the
and sketch a horizontal line through
Where the two lines meet, we plot the point
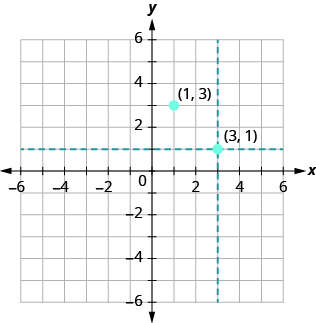
Notice that the order of the coordinates does matter, so, is not the same point as
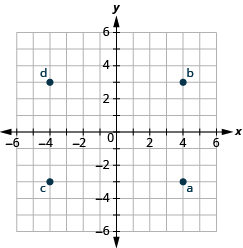
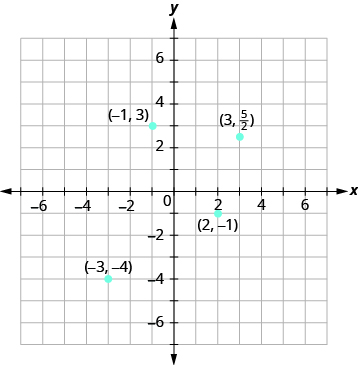
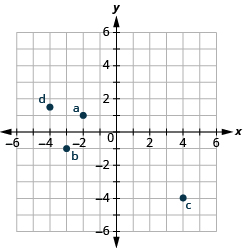
Plot each point in the rectangular coordinate system and identify the quadrant in which the point is located:
The first number of the coordinate pair is the and the second number is the
ⓐ Since the point is in Quadrant II.
ⓑ Since the point is in Quadrant III.
ⓒ Since the point is in Quadrant lV.
ⓓ Since
the point
is in Quadrant I. It may be helpful to write
as the mixed number,
or decimal,
Then we know that the point is halfway between
and
on the
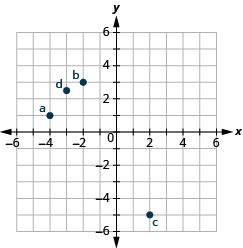
Plot each point on a rectangular coordinate system and identify the quadrant in which the point is located:
Plot each point on a rectangular coordinate system and identify the quadrant in which the point is located
How do the signs affect the location of the points?
Plot each point:
As we locate the
and the
we must be careful with the signs.
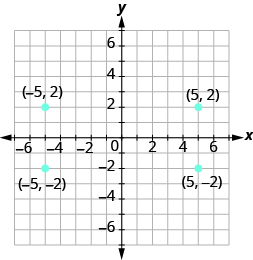
You may have noticed some patterns as you graphed the points in the two previous examples.
For each point in Quadrant IV, what do you notice about the signs of the coordinates?
What about the signs of the coordinates of the points in the third quadrant? The second quadrant? The first quadrant?
Can you tell just by looking at the coordinates in which quadrant the point (−2, 5) is located? In which quadrant is (2, −5) located?
Notification Switch
Would you like to follow the 'Prealgebra' conversation and receive update notifications?

|
|

|
|

|
|

|
|

|
|

|
|

|
|

|
|
|
|
|

|