<< Chapter < Page Chapter >> Page >

Preview of the Scratch program

Now it's time to write and discuss a Scratch program. You should be able to replicate this program.

Hopefully by now you have installed Scratch on your computer and you have worked through all of the tutorials that you can find on Scratch as recommendedin the previous module. If not, you should do that before continuing with this module.

In case you skipped the section titled An overview of computer programming , you still might want to go back and review the section on Variables .

The Scratch program named Variable01 .sb

This Scratch program illustrates the creation and manipulation of two simple numeric variables.

Prior to the release of Scratch version 1.4, only numeric variables were allowed inScratch. However, according to the Scratch 1.4 Release Notes , variables can now contain strings of characters. Experimentation indicates that they can also contain the boolean values of True and False (or possibly strings that represent boolean values). The previous Numbers button has been replaced by an Operators button (see Image 2 ) because it now contains blocks for manipulating strings.

This program also illustrates the case sensitivity of variable names along with the ability to detect and respond to events fired by the keyboard andevents fired by the mouse.

A variable named Counter

A variable named Counter (with an upper-case "C") is created, initialized to 0, and displayed in the upper-left corner of the Stage area in the Scratch user interface (see Image 1 ) . When the user clicks the green flag in the upper-right corner of Image 1 , the value of the variable is set to zero. Each time the user presses the space bar, the value of the variable is increased by 1. Each timethe user clicks the mouse in the blank area of the Stage, the value of the variable is decreased by 1.

A variable named counter

Another variable named counter (with a lower-case "c") is created, initialized to 0, and displayed below the Counter variable on the Stage. Again, when the user clicks the green flag in the upper-right cornerof Image 1 , the value of the variable is set to zero. Each time the user presses the space bar, the value of thisvariable is increased by 5. Each time the user clicks the mouse in the blank area of the Stage, the value of this variable is decreased by 5.

Discussion and sample code

Image 1 shows a greatly reduced image of the Scratch user interface for the program named Variable01 for Scratch version 1.4.

Image 1. a reduced image of the scratch user interface for the program named variable01.

Missing image.
Image 1. A reduced image of the Scratch user interface for the program named Variable01.

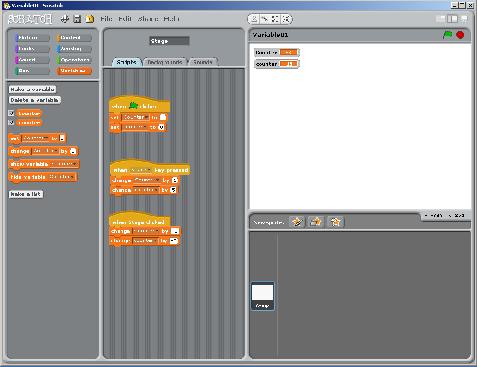
You probably can't read any of the text in Image 1 . The image is presented here solely to provide an overview of the user interface. I will provide additional (more readable) images later that show and discuss the separate parts of the user interface.

No sprites

There are a few things that we can deduce by viewing the reduced image in Image 1 . First, note that there are no sprites in this program. The program consists solely of

Questions & Answers

differentiate between demand and supply giving examples
Lambiv Reply
differentiated between demand and supply using examples
Lambiv
what is labour ?
Lambiv
how will I do?
Venny Reply
how is the graph works?I don't fully understand
Rezat Reply
information
Eliyee
devaluation
Eliyee
t
WARKISA
hi guys good evening to all
Lambiv
multiple choice question
Aster Reply
appreciation
Eliyee
explain perfect market
Lindiwe Reply
In economics, a perfect market refers to a theoretical construct where all participants have perfect information, goods are homogenous, there are no barriers to entry or exit, and prices are determined solely by supply and demand. It's an idealized model used for analysis,
Ezea
What is ceteris paribus?
Shukri Reply
other things being equal
AI-Robot
When MP₁ becomes negative, TP start to decline. Extuples Suppose that the short-run production function of certain cut-flower firm is given by: Q=4KL-0.6K2 - 0.112 • Where is quantity of cut flower produced, I is labour input and K is fixed capital input (K-5). Determine the average product of lab
Kelo
Extuples Suppose that the short-run production function of certain cut-flower firm is given by: Q=4KL-0.6K2 - 0.112 • Where is quantity of cut flower produced, I is labour input and K is fixed capital input (K-5). Determine the average product of labour (APL) and marginal product of labour (MPL)
Kelo
yes,thank you
Shukri
Can I ask you other question?
Shukri
what is monopoly mean?
Habtamu Reply
What is different between quantity demand and demand?
Shukri Reply
Quantity demanded refers to the specific amount of a good or service that consumers are willing and able to purchase at a give price and within a specific time period. Demand, on the other hand, is a broader concept that encompasses the entire relationship between price and quantity demanded
Ezea
ok
Shukri
how do you save a country economic situation when it's falling apart
Lilia Reply
what is the difference between economic growth and development
Fiker Reply
Economic growth as an increase in the production and consumption of goods and services within an economy.but Economic development as a broader concept that encompasses not only economic growth but also social & human well being.
Shukri
production function means
Jabir
What do you think is more important to focus on when considering inequality ?
Abdisa Reply
any question about economics?
Awais Reply
sir...I just want to ask one question... Define the term contract curve? if you are free please help me to find this answer 🙏
Asui
it is a curve that we get after connecting the pareto optimal combinations of two consumers after their mutually beneficial trade offs
Awais
thank you so much 👍 sir
Asui
In economics, the contract curve refers to the set of points in an Edgeworth box diagram where both parties involved in a trade cannot be made better off without making one of them worse off. It represents the Pareto efficient allocations of goods between two individuals or entities, where neither p
Cornelius
In economics, the contract curve refers to the set of points in an Edgeworth box diagram where both parties involved in a trade cannot be made better off without making one of them worse off. It represents the Pareto efficient allocations of goods between two individuals or entities,
Cornelius
Suppose a consumer consuming two commodities X and Y has The following utility function u=X0.4 Y0.6. If the price of the X and Y are 2 and 3 respectively and income Constraint is birr 50. A,Calculate quantities of x and y which maximize utility. B,Calculate value of Lagrange multiplier. C,Calculate quantities of X and Y consumed with a given price. D,alculate optimum level of output .
Feyisa Reply
Answer
Feyisa
c
Jabir
the market for lemon has 10 potential consumers, each having an individual demand curve p=101-10Qi, where p is price in dollar's per cup and Qi is the number of cups demanded per week by the i th consumer.Find the market demand curve using algebra. Draw an individual demand curve and the market dema
Gsbwnw Reply
suppose the production function is given by ( L, K)=L¼K¾.assuming capital is fixed find APL and MPL. consider the following short run production function:Q=6L²-0.4L³ a) find the value of L that maximizes output b)find the value of L that maximizes marginal product
Abdureman
types of unemployment
Yomi Reply
What is the difference between perfect competition and monopolistic competition?
Mohammed
Got questions? Join the online conversation and get instant answers!
Jobilize.com Reply

Get Jobilize Job Search Mobile App in your pocket Now!

Get it on Google Play Download on the App Store Now


Source:  OpenStax, Teaching beginners to code. OpenStax CNX. May 27, 2013 Download for free at http://cnx.org/content/col11498/1.20
Google Play and the Google Play logo are trademarks of Google Inc.

Notification Switch

Would you like to follow the 'Teaching beginners to code' conversation and receive update notifications?

Ask