

| << Chapter < Page | Chapter >> Page > |
To read an image file, use the following command:
>>[y]=imread(‘filename’, ‘filetype’)
This command reads a grayscale or color image from the string filename, where filetype specifies the format of the file and returns the image data in the array y.
Several tools are available in LabVIEW to display data in a graphical format. Throughout the book, signals in both the time and frequency domains are displayed using the following two graph tools.
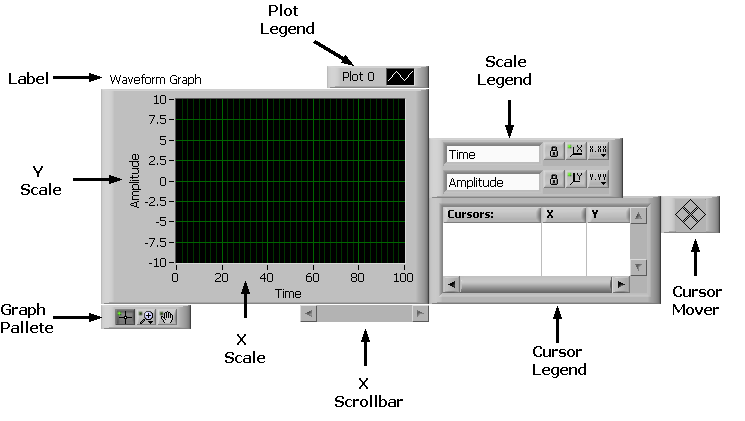
Waveform Graph—Displays data acquired at a constant rate.
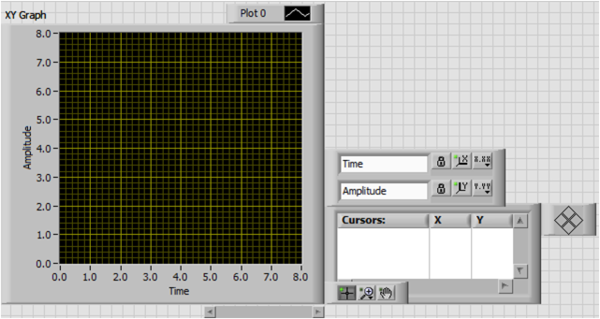
XY Graph—Displays data acquired at a non-constant rate, such as data acquired when a trigger occurs. A waveform graph can be created on a front panel by choosing Controls → Express → Waveform Graph . [link] shows a waveform graph and the waveform graph elements which can be opened by right-clicking on the graph and selecting Visible Items from the shortcut menu.
Often a waveform graph is tied with the function Build Waveform (Function → Programming → Waveform → Build Waveform) to calibrate the x scale (which is time scale for signals), as shown in [link] .

Create an XY graph from a front panel by choosing Controls → Express → XY Graph . [link] shows an XY graph and its different elements.
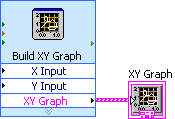
An XY graph displays a signal at a non-constant rate, and one can tie together its X and Y vectors to display the signal via the Build XY Graph function. This function automatically appears on the block diagram when placing an XY graph on the front panel, as shown in [link] . Note that one can use the function Bundle (Functions → Programming → Cluster&Variant → Bundle) instead of Build XY Graph .
As stated earlier, the LabVIEW MathScript feature can be used to perform hybrid programming, in other words, a combination of textual .m files and graphical objects. Normally, it is easier to carry out math operations via .m files while maintaining user interfacing, interactivity and analysis in the more intuitive graphical environment of LabVIEW. Textual .m file codes can be typed in or copied and pasted into LabVIEW MathScript nodes.
Sum and Average VI Example Using Hybrid Programming
Choose Functions → Programming → Structures → MathScript to create a LabVIEW MathScript node (see [link] ). Change the size of the window by dragging the mouse.

Now build the same program average using a LabVIEW MathScript node. The inputs to this program consist of x and y. To add these inputs, right-click on the border of the LabVIEW MathScript node and click on the Add Input option (see [link] ).
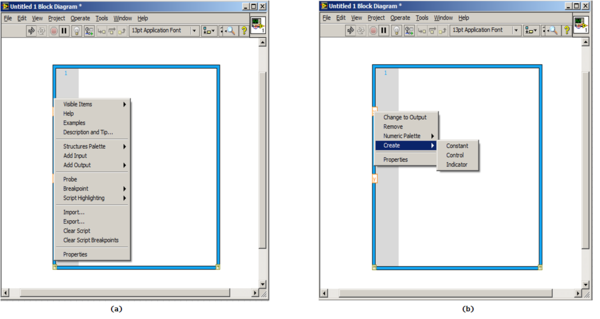
After adding these inputs, create controls to change the inputs interactively via the front panel. By right-clicking on the border, add outputs in a similar manner. An important issue to consider is the selection of output data type. The outputs of the Sum and Average VI are scalar quantities. Choose data types by right-clicking on an output and selecting the Choose Data Type option (see [link] ).
Notification Switch
Would you like to follow the 'An interactive approach to signals and systems laboratory' conversation and receive update notifications?

|
|

|
|

|
|

|
|

|
|

|
|

|
|
|
|
|

|
|

|