

| << Chapter < Page | Chapter >> Page > |
Replace the ramp generator input with a step function. This simulates someone stamping on the gas!
Open VehicleDynamicsF2812Simulation.mdl .
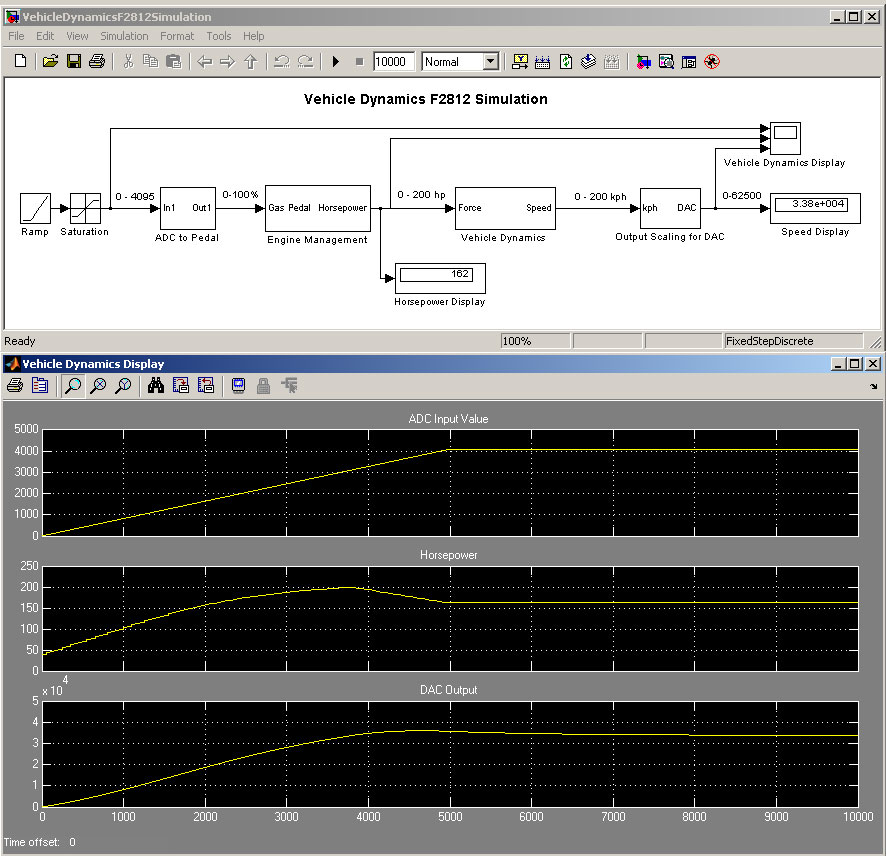
Run this model. This is the behavior that should be seen when the real-time model is run on the ezDSP for F2812.
Start Matlab 7.3.0 R2006b
In the top left hand corner of the Matlab screen, select: File ->New ->Model.
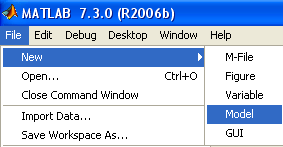
The following screen will appear.

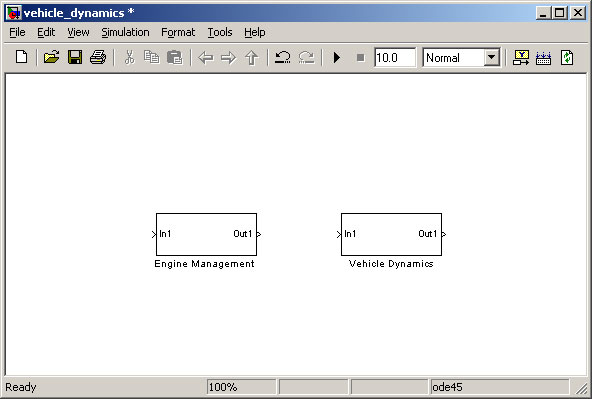
Save the model as “vehicle_dynamics.mdl”.

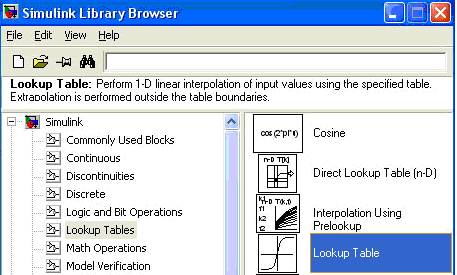
Select View->Library Browser

A list of available blocks will appear. Select “Commonly used blocks”. Highlight “Subsystems”. Drag-and-drop two copies of this block into the model.

Rename the Subsystems to “Engine Management” and “Vehicle Dynamics”.
Drag-and-drop a “saturation” block onto the model.
From the Simulink Library Browser, select “Sources”. Drag-and-drop the “Ramp” block onto the model.

From the Simulink Library Browser, select “Sinks”.
Drag-and-drop the “Scope” block onto the model twice.
Drag-and-drop the “Display” block onto the model twice.

Join the blocks as shown in the figure below. Change the names and add a title.

The ode45 solver is not suitable for use with DSP. “Fixed Point Discrete” is required.

The first stage of the Engine Management Subsystem is a “Gain” block, which converts the Gas Pedal input (0-100%) to 0-4000 rpm.
The second stage is a lookup table. This converts from rpm to hp.

From the Simulink Lookup Tables, drag-and-drop the “Lookup Table” block onto the model.
Double click on the “Lookup Table” block.
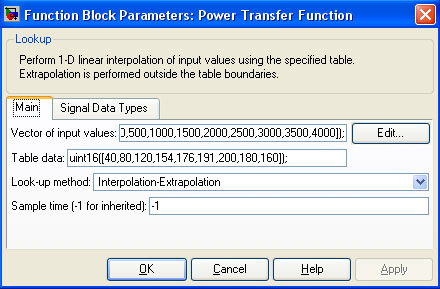
The values for the table can also be inserted as a table. Click on the “Edit” box.

Click on "Plot" as shown above, and you will see:

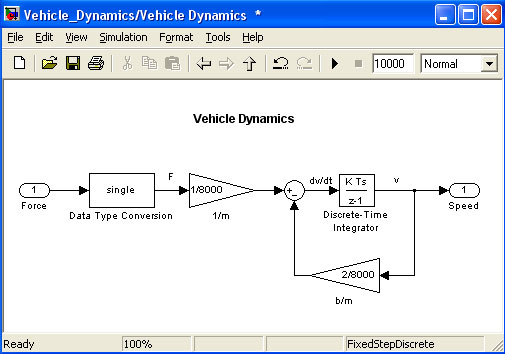
The C28x operates in discrete-time; therefore the continuous integrator must be replaced by a “Discrete Time Integrator” for DSP model implementation.
Select the “Main” tab. Change the “Constant value” to 0. Click on “OK”.
The ramp generator gently changes the Gas Pedal from 0% to 100%. This simulates smooth acceleration. The Horsepower and Vehicle Speed are shown on the graphs.

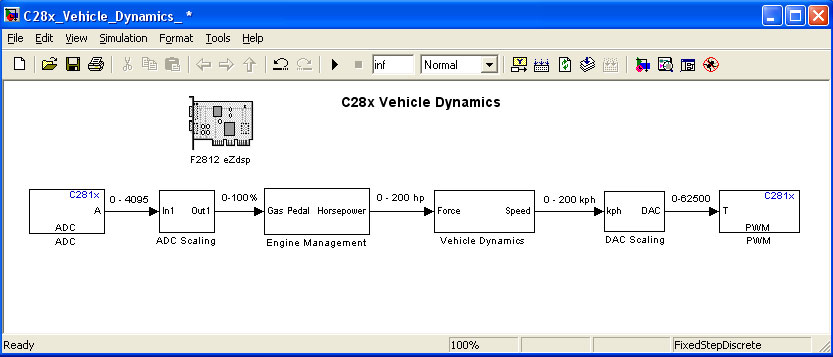
In order to run the model on the ezDSP F2812, some additional blocks need to be added to the project:
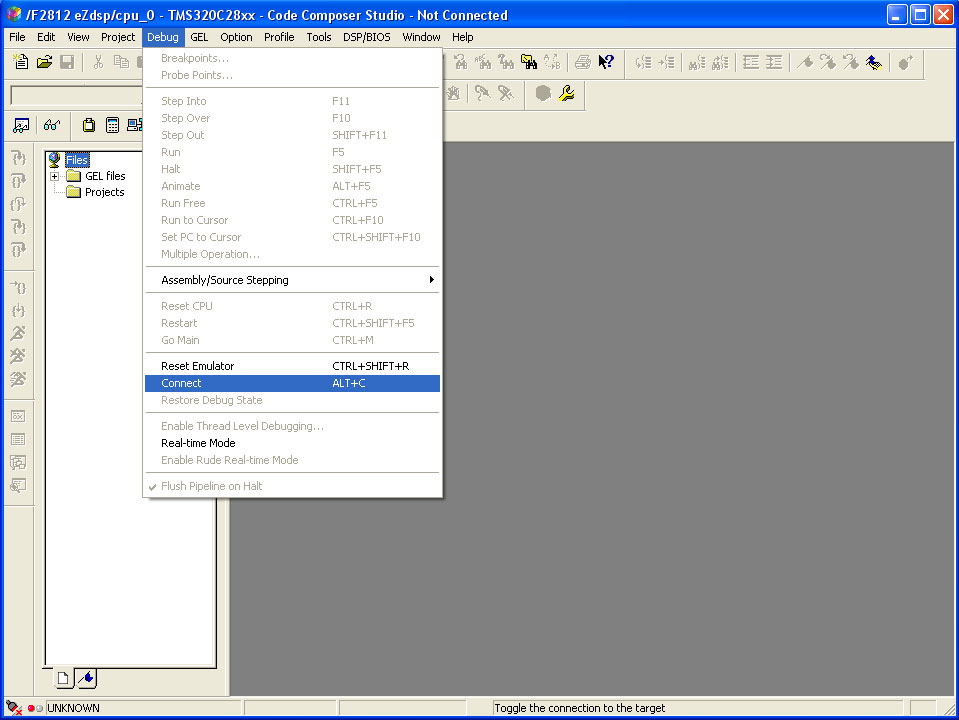
For Matlab and Simulink to run correctly, you need to run the F2812 ezDSP.
Connect the F2812 hardware to the parallel port of the computer and turn on the supply to the board.
When the board is powered, the two green LED lights on the board will come on during self-test.
Start Code Composer Studio for F2812 ezDSP and use Debug ->Connect
Select View->Library Browser

A list of available blocks will appear. We are particularly interested in the “Embedded Target for TI C2000 DSP”. Click on this selection.
In the following sections we will select the building blocks for the DSP model shown in Figure 30.

From the C2000 Target Preferences, select “F2812 ezDSP”. Drag-and-drop the icon onto the new model.

Figure 26 – Selecting Target Preferences
When the following screen appears, it is important to select “Yes”.

To scale the ADC reading to the Gas Pedal 0 to 100% we will multiply the ADC input by 800 then divide by 32768.

Figure 28 – Scaling the ADC
To scale the kph to the DAC output, we will multiply the kph input by 312.5. The “Saturation” block limits the output to 200 kph.

To scale the kph to the DAC output, we will multiply the kph input by 312.5.
Select Tools ->Real-Time Workshop ->Build Model.

You may find the final model here .
The real-time model running on the ezDSP F2812 should now be behaving in the same way as the Simulation.
Notification Switch
Would you like to follow the 'From matlab and simulink to real-time with ti dsp's' conversation and receive update notifications?

|
|

|
|

|
|

|
|

|
|
|
|
|

|
|

|
|

|
|

|