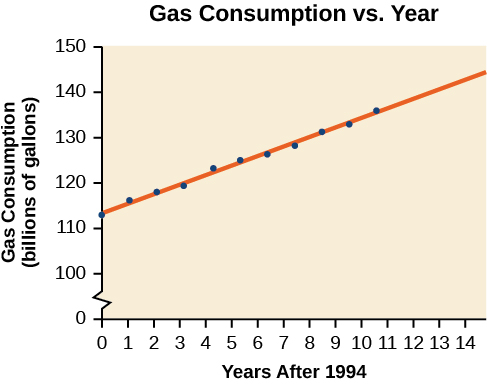
Gasoline consumption in the United States has been steadily increasing. Consumption data from 1994 to 2004 is shown in
[link] .
http://www.bts.gov/publications/national_transportation_statistics/2005/html/table_04_10.html Determine whether the trend is linear, and if so, find a model for the data. Use the model to predict the consumption in 2008.
Year
'94
'95
'96
'97
'98
'99
'00
'01
'02
'03
'04
Consumption (billions of gallons)
113
116
118
119
123
125
126
128
131
133
136
The scatter plot of the data, including the least squares regression line, is shown in
[link] .
We can introduce new input variable,
representing years since 1994.
The least squares regression equation is:
Using technology, the correlation coefficient was calculated to be 0.9965, suggesting a very strong increasing linear trend.
Using this to predict consumption in 2008
The model predicts 144.244 billion gallons of gasoline consumption in 2008.
Scatter plots show the relationship between two sets of data. See
[link] .
Scatter plots may represent linear or non-linear models.
The line of best fit may be estimated or calculated, using a calculator or statistical software. See
[link] .
Interpolation can be used to predict values inside the domain and range of the data, whereas extrapolation can be used to predict values outside the domain and range of the data. See
[link] .
The correlation coefficient,
indicates the degree of linear relationship between data. See
[link] .
A regression line best fits the data. See
[link] .
The least squares regression line is found by minimizing the squares of the distances of points from a line passing through the data and may be used to make predictions regarding either of the variables. See
[link] .
Section exercises
Verbal
Describe what it means if there is a model breakdown when using a linear model.
When our model no longer applies, after some value in the domain, the model itself doesn’t hold.
A regression was run to determine whether there is a relationship between hours of TV watched per day
and number of sit-ups a person can do
The results of the regression are given below. Use this to predict the number of sit-ups a person who watches 11 hours of TV can do.
In economics, a perfect market refers to a theoretical construct where all participants have perfect information, goods are homogenous, there are no barriers to entry or exit, and prices are determined solely by supply and demand. It's an idealized model used for analysis,
When MP₁ becomes negative, TP start to decline.
Extuples Suppose that the short-run production function of certain cut-flower firm is given by: Q=4KL-0.6K2 - 0.112 •
Where is quantity of cut flower produced, I is labour input and K is fixed capital input (K-5). Determine the average product of lab
Kelo
Extuples Suppose that the short-run production function of certain cut-flower firm is given by: Q=4KL-0.6K2 - 0.112 •
Where is quantity of cut flower produced, I is labour input and K is fixed capital input (K-5). Determine the average product of labour (APL) and marginal product of labour (MPL)
Quantity demanded refers to the specific amount of a good or service that consumers are willing and able to purchase at a give price and within a specific time period. Demand, on the other hand, is a broader concept that encompasses the entire relationship between price and quantity demanded
Ezea
ok
Shukri
how do you save a country economic situation when it's falling apart
Economic growth as an increase in the production and consumption of goods and services within an economy.but
Economic development as a broader concept that encompasses not only economic growth but also social & human well being.
Shukri
production function means
Jabir
What do you think is more important to focus on when considering inequality ?
sir...I just want to ask one question... Define the term contract curve? if you are free please help me to find this answer 🙏
Asui
it is a curve that we get after connecting the pareto optimal combinations of two consumers after their mutually beneficial trade offs
Awais
thank you so much 👍 sir
Asui
In economics, the contract curve refers to the set of points in an Edgeworth box diagram where both parties involved in a trade cannot be made better off without making one of them worse off. It represents the Pareto efficient allocations of goods between two individuals or entities, where neither p
Cornelius
In economics, the contract curve refers to the set of points in an Edgeworth box diagram where both parties involved in a trade cannot be made better off without making one of them worse off. It represents the Pareto efficient allocations of goods between two individuals or entities,
Cornelius
Suppose a consumer consuming two commodities X and Y has
The following utility function u=X0.4 Y0.6. If the price of the X and Y are 2 and 3 respectively and income Constraint is birr 50.
A,Calculate quantities of x and y which maximize utility.
B,Calculate value of Lagrange multiplier.
C,Calculate quantities of X and Y consumed with a given price.
D,alculate optimum level of output .
the market for lemon has 10 potential consumers, each having an individual demand curve p=101-10Qi, where p is price in dollar's per cup and Qi is the number of cups demanded per week by the i th consumer.Find the market demand curve using algebra. Draw an individual demand curve and the market dema
suppose the production function is given by ( L, K)=L¼K¾.assuming capital is fixed find APL and MPL. consider the following short run production function:Q=6L²-0.4L³ a) find the value of L that maximizes output b)find the value of L that maximizes marginal product