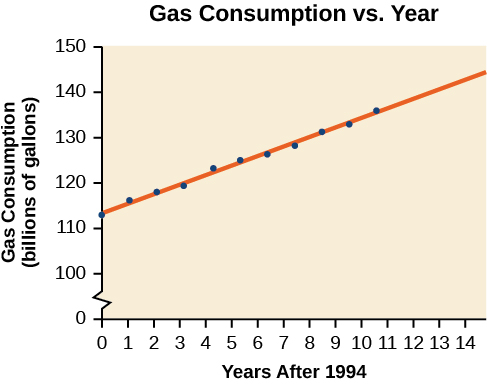
Gasoline consumption in the United States has been steadily increasing. Consumption data from 1994 to 2004 is shown in
[link] .
http://www.bts.gov/publications/national_transportation_statistics/2005/html/table_04_10.html Determine whether the trend is linear, and if so, find a model for the data. Use the model to predict the consumption in 2008.
Year
'94
'95
'96
'97
'98
'99
'00
'01
'02
'03
'04
Consumption (billions of gallons)
113
116
118
119
123
125
126
128
131
133
136
The scatter plot of the data, including the least squares regression line, is shown in
[link] .
We can introduce new input variable,
representing years since 1994.
The least squares regression equation is:
Using technology, the correlation coefficient was calculated to be 0.9965, suggesting a very strong increasing linear trend.
Using this to predict consumption in 2008
The model predicts 144.244 billion gallons of gasoline consumption in 2008.
Scatter plots show the relationship between two sets of data. See
[link] .
Scatter plots may represent linear or non-linear models.
The line of best fit may be estimated or calculated, using a calculator or statistical software. See
[link] .
Interpolation can be used to predict values inside the domain and range of the data, whereas extrapolation can be used to predict values outside the domain and range of the data. See
[link] .
The correlation coefficient,
indicates the degree of linear relationship between data. See
[link] .
A regression line best fits the data. See
[link] .
The least squares regression line is found by minimizing the squares of the distances of points from a line passing through the data and may be used to make predictions regarding either of the variables. See
[link] .
Section exercises
Verbal
Describe what it means if there is a model breakdown when using a linear model.
When our model no longer applies, after some value in the domain, the model itself doesn’t hold.
A regression was run to determine whether there is a relationship between hours of TV watched per day
and number of sit-ups a person can do
The results of the regression are given below. Use this to predict the number of sit-ups a person who watches 11 hours of TV can do.
Astronomy (from Ancient Greek ἀστρονομία (astronomía) 'science that studies the laws of the stars') is a natural science that studies celestial objects and phenomena. It uses mathematics, physics, and chemistry in order to explain their origin and evolution.
Rafael
vjuvu
Elgoog
what is big bang theory?
Rosemary
what type of activity astronomer do?
Rosemary
No
Richard
the big bang theory is a theory which states that all matter was compressed together in one place the matter got so unstable it exploded releasing All its contents in the form of hydrogen
according to the theory of astronomers why the moon is always appear in an elliptical orbit?
Gatjuol
hi !!! I am new in astronomy....
I have so many questions in mind ....
all of scientists of the word they just give opinion only.
but they never think true or false ...
i respect all of them...
I believes whole universe depending
on true ...থিউরি
Govinda
hello
Jackson
hi
Elyana
we're all stars and galaxies a part of sun. how can science prove thx with respect old ancient times picture or books..or anything with respect to present time .but we r a part of that universe
there many theory to born universe but what is the reality of big bang theory to born universe
Asmit
what is the exact value of π?
Nagalakshmi
by big bang
universal
there are many theories regarding this it's on you believe any theory that you think is true ex. eternal inflation theory, oscillation model theory, multiple universe theory the big bang theory etc.
Aarya
I think after Big Bang!
Michele
from where on earth could u observe all the stars during the during the course of an year
is that so. the question was in the end of this chapter
Karuna
in theory, you could see them all from the equator (though over the course of a year, not at pne time). stars are measured in "declination", which is how far N or S of the equator (90* to -90*). Polaris is the North star, and is ALMOST 90* (+89*).
So it would just barely creep over the horizon.
Christopher
Got questions? Join the online conversation and get instant answers!