Given the function
express the function as a polynomial in general form and determine the leading term, degree, and end behavior of the function.
The leading term is
so it is a degree 3 polynomial. As
approaches positive infinity,
increases without bound; as
approaches negative infinity,
decreases without bound.
Identifying local behavior of polynomial functions
In addition to the end behavior of polynomial functions, we are also interested in what happens in the “middle” of the function. In particular, we are interested in locations where graph behavior changes. A
turning point is a point at which the function values change from increasing to decreasing or decreasing to increasing.
We are also interested in the intercepts. As with all functions, the
y- intercept is the point at which the graph intersects the vertical axis. The point corresponds to the coordinate pair in which the input value is zero. Because a polynomial is a function, only one output value corresponds to each input value so there can be only one
y- intercept
The
x- intercepts occur at the input values that correspond to an output value of zero. It is possible to have more than one
x- intercept. See
[link].
Intercepts and turning points of polynomial functions
A
turning point of a graph is a point at which the graph changes direction from increasing to decreasing or decreasing to increasing. The
y- intercept is the point at which the function has an input value of zero. The
x -intercepts are the points at which the output value is zero.
Given a polynomial function, determine the intercepts.
Determine the
y- intercept by setting
and finding the corresponding output value.
Determine the
x -intercepts by solving for the input values that yield an output value of zero.
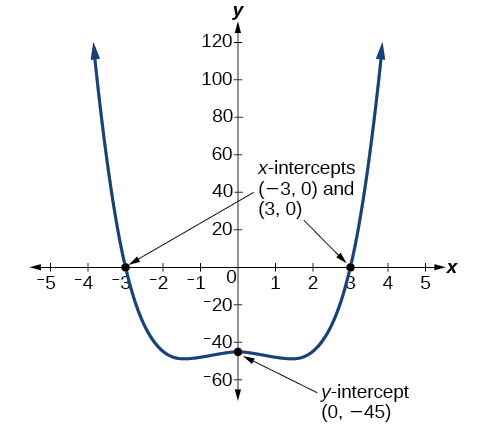
Determining the intercepts of a polynomial function
Given the polynomial function
written in factored form for your convenience, determine the
y - and
x -intercepts.
The
y- intercept occurs when the input is zero so substitute 0 for
The
y- intercept is (0, 8).
The
x -intercepts occur when the output is zero.
The
x -intercepts are
and
We can see these intercepts on the graph of the function shown in
[link] .
Step 1: Find the mean. To find the mean, add up all the scores, then divide them by the number of scores. ...
Step 2: Find each score's deviation from the mean. ...
Step 3: Square each deviation from the mean. ...
Step 4: Find the sum of squares. ...
Step 5: Divide the sum of squares by n – 1 or N.
The sample of 16 students is taken. The average age in the sample was 22 years with astandard deviation of 6 years. Construct a 95% confidence interval for the age of the population.
Bhartdarshan' is an internet-based travel agency wherein customer can see videos of the cities they plant to visit. The number of hits daily is a normally distributed random variable with a mean of 10,000 and a standard deviation of 2,400
a. what is the probability of getting more than 12,000 hits?
b. what is the probability of getting fewer than 9,000 hits?
Bhartdarshan'is an internet-based travel agency wherein customer can see videos of the cities they plan to visit. The number of hits daily is a normally distributed random variable with a mean of 10,000 and a standard deviation of 2,400.
a. What is the probability of getting more than 12,000 hits