Identifying the degree and leading coefficient of a polynomial function
Identify the degree, leading term, and leading coefficient of the following polynomial functions.
For the function
the highest power of
is 3, so the degree is 3. The leading term is the term containing that degree,
The leading coefficient is the coefficient of that term,
For the function
the highest power of
is
so the degree is
The leading term is the term containing that degree,
The leading coefficient is the coefficient of that term,
For the function
the highest power of
is
so the degree is
The leading term is the term containing that degree,
The leading coefficient is the coefficient of that term,
Knowing the degree of a polynomial function is useful in helping us predict its end behavior. To determine its end behavior, look at the leading term of the polynomial function. Because the power of the leading term is the highest, that term will grow significantly faster than the other terms as
gets very large or very small, so its behavior will dominate the graph. For any polynomial, the end behavior of the polynomial will match the end behavior of the power function consisting of the leading term. See
[link] .
Polynomial Function
Leading Term
Graph of Polynomial Function
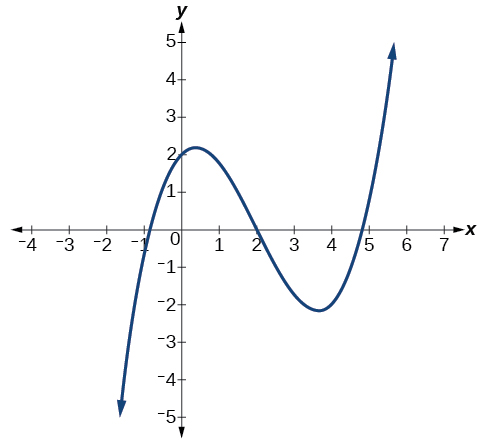
Identifying end behavior and degree of a polynomial function
Describe the end behavior and determine a possible degree of the polynomial function in
[link] .
As the input values
get very large, the output values
increase without bound. As the input values
get very small, the output values
decrease without bound. We can describe the end behavior symbolically by writing
In words, we could say that as
values approach infinity, the function values approach infinity, and as
values approach negative infinity, the function values approach negative infinity.
We can tell this graph has the shape of an odd degree power function that has not been reflected, so the degree of the polynomial creating this graph must be odd and the leading coefficient must be positive.
Identifying end behavior and degree of a polynomial function
Given the function
express the function as a polynomial in general form, and determine the leading term, degree, and end behavior of the function.
Obtain the general form by expanding the given expression for
The general form is
The leading term is
therefore, the degree of the polynomial is 4. The degree is even (4) and the leading coefficient is negative (–3), so the end behavior is
Step 1: Find the mean. To find the mean, add up all the scores, then divide them by the number of scores. ...
Step 2: Find each score's deviation from the mean. ...
Step 3: Square each deviation from the mean. ...
Step 4: Find the sum of squares. ...
Step 5: Divide the sum of squares by n – 1 or N.
The sample of 16 students is taken. The average age in the sample was 22 years with astandard deviation of 6 years. Construct a 95% confidence interval for the age of the population.
Bhartdarshan' is an internet-based travel agency wherein customer can see videos of the cities they plant to visit. The number of hits daily is a normally distributed random variable with a mean of 10,000 and a standard deviation of 2,400
a. what is the probability of getting more than 12,000 hits?
b. what is the probability of getting fewer than 9,000 hits?
Bhartdarshan'is an internet-based travel agency wherein customer can see videos of the cities they plan to visit. The number of hits daily is a normally distributed random variable with a mean of 10,000 and a standard deviation of 2,400.
a. What is the probability of getting more than 12,000 hits