<< Chapter < Page Chapter >> Page >
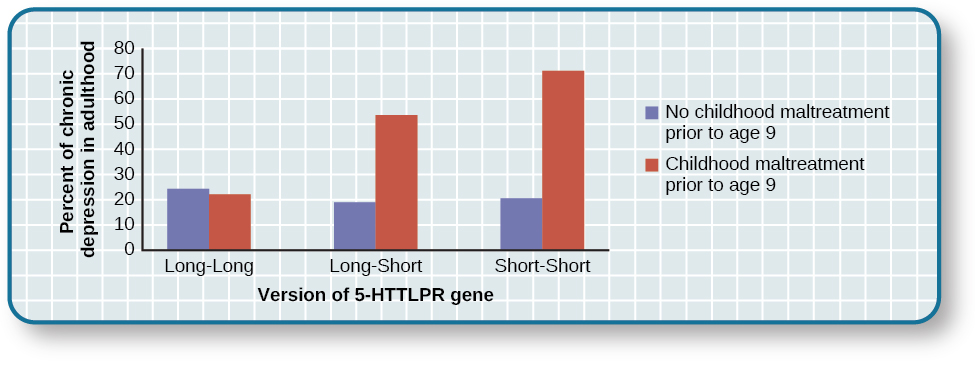
A bar graph has an x-axis labeled “version of 5-HTTLPR gene” and a y-axis labeled “percent of chronic depression in adulthood.” Data compares the type of gene combination and whether childhood maltreatment occurred prior to age 9. People with no childhood maltreatment prior to age 9 have a percentage of chronic depression of approximately 23% with the long-long gene, 19% with the long-short gene, and 20% with the short-short gene. People with childhood maltreatment prior to age 9 have a percentage of chronic depression of approximately 22% with the long-long gene, 53% with the long-short gene, and 71% with the short-short gene.
A study on gene-environment interaction in people experiencing chronic depression in adulthood suggests a much higher incidence in individuals with a short version of the gene in combination with childhood maltreatment (Brown&Harris, 2013).

Cognitive theories of depression

Cognitive theories of depression take the view that depression is triggered by negative thoughts, interpretations, self-evaluations, and expectations (Joormann, 2009). These diathesis-stress models propose that depression is triggered by a “cognitive vulnerability” (negative and maladaptive thinking) and by precipitating stressful life events (Gotlib&Joormann, 2010). Perhaps the most well-known cognitive theory of depression was developed in the 1960s by psychiatrist Aaron Beck, based on clinical observations and supported by research (Beck, 2008). Beck theorized that depression-prone people possess depressive schemas, or mental predispositions to think about most things in a negative way (Beck, 1976). Depressive schemas contain themes of loss, failure, rejection, worthlessness, and inadequacy, and may develop early in childhood in response to adverse experiences, then remain dormant until they are activated by stressful or negative life events. Depressive schemas prompt dysfunctional and pessimistic thoughts about the self, the world, and the future. Beck believed that this dysfunctional style of thinking is maintained by cognitive biases, or errors in how we process information about ourselves, which lead us to focus on negative aspects of experiences, interpret things negatively, and block positive memories (Beck, 2008). A person whose depressive schema consists of a theme of rejection might be overly attentive to social cues of rejection (more likely to notice another’s frown), and he might interpret this cue as a sign of rejection and automatically remember past incidents of rejection. Longitudinal studies have supported Beck’s theory, in showing that a preexisting tendency to engage in this negative, self-defeating style of thinking—when combined with life stress—over time predicts the onset of depression (Dozois&Beck, 2008). Cognitive therapies for depression, aimed at changing a depressed person’s negative thinking, were developed as an expansion of this theory (Beck, 1976).

Another cognitive theory of depression, hopelessness theory    , postulates that a particular style of negative thinking leads to a sense of hopelessness, which then leads to depression (Abramson, Metalsky,&Alloy, 1989). According to this theory, hopelessness is an expectation that unpleasant outcomes will occur or that desired outcomes will not occur, and there is nothing one can do to prevent such outcomes. A key assumption of this theory is that hopelessness stems from a tendency to perceive negative life events as having stable (“It’s never going to change”) and global (“It’s going to affect my whole life”) causes, in contrast to unstable (“It’s fixable”) and specific (“It applies only to this particular situation”) causes, especially if these negative life events occur in important life realms, such as relationships, academic achievement, and the like. Suppose a student who wishes to go to law school does poorly on an admissions test. If the student infers negative life events as having stable and global causes, she may believe that her poor performance has a stable and global cause (“I lack intelligence, and it’s going to prevent me from ever finding a meaningful career”), as opposed to an unstable and specific cause (“I was sick the day of the exam, so my low score was a fluke”). Hopelessness theory predicts that people who exhibit this cognitive style in response to undesirable life events will view such events as having negative implications for their future and self-worth, thereby increasing the likelihood of hopelessness—the primary cause of depression (Abramson et al., 1989). One study testing hopelessness theory measured the tendency to make negative inferences for bad life effects in participants who were experiencing uncontrollable stressors. Over the ensuing six months, those with scores reflecting high cognitive vulnerability were 7 times more likely to develop depression compared to those with lower scores (Kleim, Gonzalo,&Ehlers, 2011).

Questions & Answers

What are the factors that affect demand for a commodity
Florence Reply
differentiate between demand and supply giving examples
Lambiv Reply
differentiated between demand and supply using examples
Lambiv
what is labour ?
Lambiv
how will I do?
Venny Reply
how is the graph works?I don't fully understand
Rezat Reply
information
Eliyee
devaluation
Eliyee
t
WARKISA
hi guys good evening to all
Lambiv
multiple choice question
Aster Reply
appreciation
Eliyee
explain perfect market
Lindiwe Reply
In economics, a perfect market refers to a theoretical construct where all participants have perfect information, goods are homogenous, there are no barriers to entry or exit, and prices are determined solely by supply and demand. It's an idealized model used for analysis,
Ezea
What is ceteris paribus?
Shukri Reply
other things being equal
AI-Robot
When MP₁ becomes negative, TP start to decline. Extuples Suppose that the short-run production function of certain cut-flower firm is given by: Q=4KL-0.6K2 - 0.112 • Where is quantity of cut flower produced, I is labour input and K is fixed capital input (K-5). Determine the average product of lab
Kelo
Extuples Suppose that the short-run production function of certain cut-flower firm is given by: Q=4KL-0.6K2 - 0.112 • Where is quantity of cut flower produced, I is labour input and K is fixed capital input (K-5). Determine the average product of labour (APL) and marginal product of labour (MPL)
Kelo
yes,thank you
Shukri
Can I ask you other question?
Shukri
what is monopoly mean?
Habtamu Reply
What is different between quantity demand and demand?
Shukri Reply
Quantity demanded refers to the specific amount of a good or service that consumers are willing and able to purchase at a give price and within a specific time period. Demand, on the other hand, is a broader concept that encompasses the entire relationship between price and quantity demanded
Ezea
ok
Shukri
how do you save a country economic situation when it's falling apart
Lilia Reply
what is the difference between economic growth and development
Fiker Reply
Economic growth as an increase in the production and consumption of goods and services within an economy.but Economic development as a broader concept that encompasses not only economic growth but also social & human well being.
Shukri
production function means
Jabir
What do you think is more important to focus on when considering inequality ?
Abdisa Reply
any question about economics?
Awais Reply
sir...I just want to ask one question... Define the term contract curve? if you are free please help me to find this answer 🙏
Asui
it is a curve that we get after connecting the pareto optimal combinations of two consumers after their mutually beneficial trade offs
Awais
thank you so much 👍 sir
Asui
In economics, the contract curve refers to the set of points in an Edgeworth box diagram where both parties involved in a trade cannot be made better off without making one of them worse off. It represents the Pareto efficient allocations of goods between two individuals or entities, where neither p
Cornelius
In economics, the contract curve refers to the set of points in an Edgeworth box diagram where both parties involved in a trade cannot be made better off without making one of them worse off. It represents the Pareto efficient allocations of goods between two individuals or entities,
Cornelius
Suppose a consumer consuming two commodities X and Y has The following utility function u=X0.4 Y0.6. If the price of the X and Y are 2 and 3 respectively and income Constraint is birr 50. A,Calculate quantities of x and y which maximize utility. B,Calculate value of Lagrange multiplier. C,Calculate quantities of X and Y consumed with a given price. D,alculate optimum level of output .
Feyisa Reply
Answer
Feyisa
c
Jabir
the market for lemon has 10 potential consumers, each having an individual demand curve p=101-10Qi, where p is price in dollar's per cup and Qi is the number of cups demanded per week by the i th consumer.Find the market demand curve using algebra. Draw an individual demand curve and the market dema
Gsbwnw Reply
suppose the production function is given by ( L, K)=L¼K¾.assuming capital is fixed find APL and MPL. consider the following short run production function:Q=6L²-0.4L³ a) find the value of L that maximizes output b)find the value of L that maximizes marginal product
Abdureman
Got questions? Join the online conversation and get instant answers!
Jobilize.com Reply

Get Jobilize Job Search Mobile App in your pocket Now!

Get it on Google Play Download on the App Store Now


Source:  OpenStax, Psychology. OpenStax CNX. Feb 03, 2015 Download for free at https://legacy.cnx.org/content/col11629/1.5
Google Play and the Google Play logo are trademarks of Google Inc.

Notification Switch

Would you like to follow the 'Psychology' conversation and receive update notifications?

Ask