<< Chapter < Page Chapter >> Page >

Brain imaging

You have learned how brain injury can provide information about the functions of different parts of the brain. Increasingly, however, we are able to obtain that information using brain imaging techniques on individuals who have not suffered brain injury. In this section, we take a more in-depth look at some of the techniques that are available for imaging the brain, including techniques that rely on radiation, magnetic fields, or electrical activity within the brain.

Techniques involving radiation

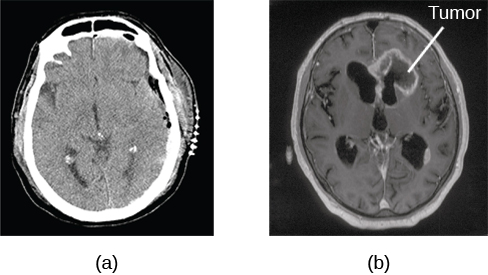
A computerized tomography (CT) scan    involves taking a number of x-rays of a particular section of a person’s body or brain ( [link] ). The x-rays pass through tissues of different densities at different rates, allowing a computer to construct an overall image of the area of the body being scanned. A CT scan is often used to determine whether someone has a tumor, or significant brain atrophy.

Image (a) shows a brain scan where the brain matter’s appearance is fairly uniform. Image (b) shows a section of the brain that looks different from the surrounding tissue and is labeled “tumor.”
A CT scan can be used to show brain tumors. (a) The image on the left shows a healthy brain, whereas (b) the image on the right indicates a brain tumor in the left frontal lobe. (credit a: modification of work by "Aceofhearts1968"/Wikimedia Commons; credit b: modification of work by Roland Schmitt et al)

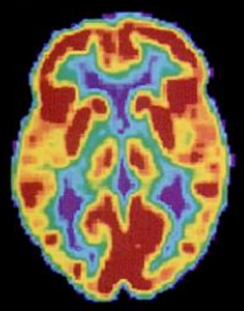
Positron emission tomography (PET) scans create pictures of the living, active brain ( [link] ). An individual receiving a PET scan drinks or is injected with a mildly radioactive substance, called a tracer. Once in the bloodstream, the amount of tracer in any given region of the brain can be monitored. As brain areas become more active, more blood flows to that area. A computer monitors the movement of the tracer and creates a rough map of active and inactive areas of the brain during a given behavior. PET scans show little detail, are unable to pinpoint events precisely in time, and require that the brain be exposed to radiation; therefore, this technique has been replaced by the fMRI as an alternative diagnostic tool. However, combined with CT, PET technology is still being used in certain contexts. For example, CT/PET scans allow better imaging of the activity of neurotransmitter receptors and open new avenues in schizophrenia research. In this hybrid CT/PET technology, CT contributes clear images of brain structures, while PET shows the brain’s activity.

A brain scan shows different parts of the brain in different colors.
A PET scan is helpful for showing activity in different parts of the brain. (credit: Health and Human Services Department, National Institutes of Health)

Techniques involving magnetic fields

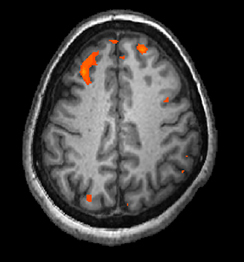
In magnetic resonance imaging (MRI)    , a person is placed inside a machine that generates a strong magnetic field. The magnetic field causes the hydrogen atoms in the body’s cells to move. When the magnetic field is turned off, the hydrogen atoms emit electromagnetic signals as they return to their original positions. Tissues of different densities give off different signals, which a computer interprets and displays on a monitor. Functional magnetic resonance imaging (fMRI) operates on the same principles, but it shows changes in brain activity over time by tracking blood flow and oxygen levels. The fMRI provides more detailed images of the brain’s structure, as well as better accuracy in time, than is possible in PET scans ( [link] ). With their high level of detail, MRI and fMRI are often used to compare the brains of healthy individuals to the brains of individuals diagnosed with psychological disorders. This comparison helps determine what structural and functional differences exist between these populations.

A brain scan shows brain tissue in gray with some small areas highlighted red.
An fMRI shows activity in the brain over time. This image represents a single frame from an fMRI. (credit: modification of work by Kim J, Matthews NL, Park S.)

Techniques involving electrical activity

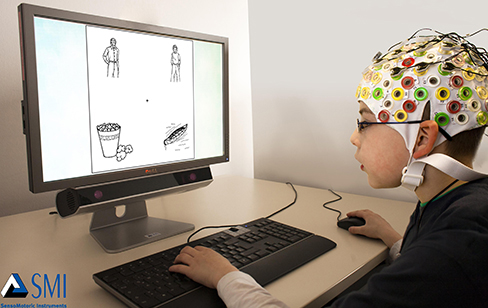
In some situations, it is helpful to gain an understanding of the overall activity of a person’s brain, without needing information on the actual location of the activity. Electroencephalography (EEG) serves this purpose by providing a measure of a brain’s electrical activity. An array of electrodes is placed around a person’s head ( [link] ). The signals received by the electrodes result in a printout of the electrical activity of his or her brain, or brainwaves, showing both the frequency (number of waves per second) and amplitude (height) of the recorded brainwaves, with an accuracy within milliseconds. Such information is especially helpful to researchers studying sleep patterns among individuals with sleep disorders.

A photograph depicts a person looking at a computer screen and using the keyboard and mouse. The person wears a white cap covered in electrodes and wires.
Using caps with electrodes, modern EEG research can study the precise timing of overall brain activities. (credit: SMI Eye Tracking)

Summary

The brain consists of two hemispheres, each controlling the opposite side of the body. Each hemisphere can be subdivided into different lobes: frontal, parietal, temporal, and occipital. In addition to the lobes of the cerebral cortex, the forebrain includes the thalamus (sensory relay) and limbic system (emotion and memory circuit). The midbrain contains the reticular formation, which is important for sleep and arousal, as well as the substantia nigra and ventral tegmental area. These structures are important for movement, reward, and addictive processes. The hindbrain contains the structures of the brainstem (medulla, pons, and midbrain), which control automatic functions like breathing and blood pressure. The hindbrain also contains the cerebellum, which helps coordinate movement and certain types of memories.

Individuals with brain damage have been studied extensively to provide information about the role of different areas of the brain, and recent advances in technology allow us to glean similar information by imaging brain structure and function. These techniques include CT, PET, MRI, fMRI, and EEG.

Personal application questions

You read about H. M.’s memory deficits following the bilateral removal of his hippocampus and amygdala. Have you encountered a character in a book, television program, or movie that suffered memory deficits? How was that character similar to and different from H. M.?

Got questions? Get instant answers now!

Questions & Answers

differentiate between demand and supply giving examples
Lambiv Reply
differentiated between demand and supply using examples
Lambiv
what is labour ?
Lambiv
how will I do?
Venny Reply
how is the graph works?I don't fully understand
Rezat Reply
information
Eliyee
devaluation
Eliyee
t
WARKISA
hi guys good evening to all
Lambiv
multiple choice question
Aster Reply
appreciation
Eliyee
explain perfect market
Lindiwe Reply
In economics, a perfect market refers to a theoretical construct where all participants have perfect information, goods are homogenous, there are no barriers to entry or exit, and prices are determined solely by supply and demand. It's an idealized model used for analysis,
Ezea
What is ceteris paribus?
Shukri Reply
other things being equal
AI-Robot
When MP₁ becomes negative, TP start to decline. Extuples Suppose that the short-run production function of certain cut-flower firm is given by: Q=4KL-0.6K2 - 0.112 • Where is quantity of cut flower produced, I is labour input and K is fixed capital input (K-5). Determine the average product of lab
Kelo
Extuples Suppose that the short-run production function of certain cut-flower firm is given by: Q=4KL-0.6K2 - 0.112 • Where is quantity of cut flower produced, I is labour input and K is fixed capital input (K-5). Determine the average product of labour (APL) and marginal product of labour (MPL)
Kelo
yes,thank you
Shukri
Can I ask you other question?
Shukri
what is monopoly mean?
Habtamu Reply
What is different between quantity demand and demand?
Shukri Reply
Quantity demanded refers to the specific amount of a good or service that consumers are willing and able to purchase at a give price and within a specific time period. Demand, on the other hand, is a broader concept that encompasses the entire relationship between price and quantity demanded
Ezea
ok
Shukri
how do you save a country economic situation when it's falling apart
Lilia Reply
what is the difference between economic growth and development
Fiker Reply
Economic growth as an increase in the production and consumption of goods and services within an economy.but Economic development as a broader concept that encompasses not only economic growth but also social & human well being.
Shukri
production function means
Jabir
What do you think is more important to focus on when considering inequality ?
Abdisa Reply
any question about economics?
Awais Reply
sir...I just want to ask one question... Define the term contract curve? if you are free please help me to find this answer 🙏
Asui
it is a curve that we get after connecting the pareto optimal combinations of two consumers after their mutually beneficial trade offs
Awais
thank you so much 👍 sir
Asui
In economics, the contract curve refers to the set of points in an Edgeworth box diagram where both parties involved in a trade cannot be made better off without making one of them worse off. It represents the Pareto efficient allocations of goods between two individuals or entities, where neither p
Cornelius
In economics, the contract curve refers to the set of points in an Edgeworth box diagram where both parties involved in a trade cannot be made better off without making one of them worse off. It represents the Pareto efficient allocations of goods between two individuals or entities,
Cornelius
Suppose a consumer consuming two commodities X and Y has The following utility function u=X0.4 Y0.6. If the price of the X and Y are 2 and 3 respectively and income Constraint is birr 50. A,Calculate quantities of x and y which maximize utility. B,Calculate value of Lagrange multiplier. C,Calculate quantities of X and Y consumed with a given price. D,alculate optimum level of output .
Feyisa Reply
Answer
Feyisa
c
Jabir
the market for lemon has 10 potential consumers, each having an individual demand curve p=101-10Qi, where p is price in dollar's per cup and Qi is the number of cups demanded per week by the i th consumer.Find the market demand curve using algebra. Draw an individual demand curve and the market dema
Gsbwnw Reply
suppose the production function is given by ( L, K)=L¼K¾.assuming capital is fixed find APL and MPL. consider the following short run production function:Q=6L²-0.4L³ a) find the value of L that maximizes output b)find the value of L that maximizes marginal product
Abdureman
types of unemployment
Yomi Reply
What is the difference between perfect competition and monopolistic competition?
Mohammed
Got questions? Join the online conversation and get instant answers!
Jobilize.com Reply

Get Jobilize Job Search Mobile App in your pocket Now!

Get it on Google Play Download on the App Store Now


Source:  OpenStax, Psychology. OpenStax CNX. Feb 03, 2015 Download for free at https://legacy.cnx.org/content/col11629/1.5
Google Play and the Google Play logo are trademarks of Google Inc.

Notification Switch

Would you like to follow the 'Psychology' conversation and receive update notifications?

Ask