<< Chapter < Page Chapter >> Page >

The programs are written to be consistent with Matlab's convention of normalizing for two samples per second sampling rate. The equationsmost of this book, however, are normalized for one sample per second.

Design examples

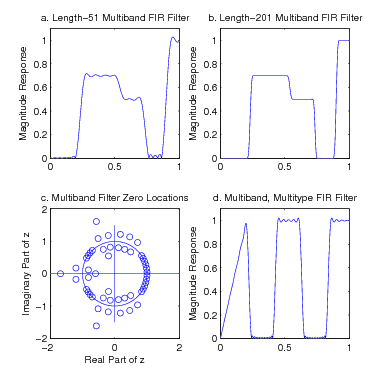
To show the results of using this new design approach, two examples of multiband filter design are presented here. The first is a filter with astopband from ω = 0 to ω = 0 . 2 , a transition band from ω = 0 . 2 to ω = 0 . 25 , a passband with gain equalto 0.7 from ω = 0 . 25 to ω = 0 . 5 , a transition band from ω = 0 . 5 to ω = 0 . 55 , a passband with gain equalto 0.5 from ω = 0 . 55 to ω = 0 . 7 , a transition band from ω = 0 . 7 to ω = 0 . 73 , a stopband from ω = 0 . 73 to ω = 0 . 85 , a transition band from ω = 0 . 85 to ω = 0 . 9 , and a passband with gain equal one from ω = 0 . 9 to ω = 1 . This is called with the Matlab program by

  h  = fir3(51,[0 .2 .25 .5 .55 .7 .73 .85 .9 1],[0 0 .7 .7.5 .5 0 0 1 1])

and the amplitude response plot shown in [link] a. The response for length of N = 101 is shown in Figures  [link] b and in [link] c the zero locations are given.

As an example of how versatile this approach can be, a length-101 linear phase multiband FIR filter wasdesigned with different types of filtering being done in different bands. The signal with frequencies in the band from 0 < f < 0 . 2 is differentiated, in the band from 0 . 23 < f < 0 . 4 is rejected, in 0 . 43 < f < 0 . 6 is Hilbert transformed, in 0 . 63 < f < 0 . 8 is rejected, and 0 . 83 < f < 1 . 0 is highpass filtered. In the transition bands between each of these processing bands, there is an optimal spline transition function. The amplitude response is shown in Figure 7d. This is a truly versatile multibanddesign technique with the only major limitation being that weighting is not possible. However, that limitation is removed in the next secession.

This figure consist of four different graphs. The top left graph is labeled a. Length-51 Multiband FIR Filter. The y axis is labeled Magnitude Response. This graph consist of a wave form that starts with a squiggly section that is pretty much on top of the y=0 line and then the wave rises quickly at an almost vertical slope to y=.7. Then the wave squiggles til (.5 .7) where the slope takes an extremely negative slope and then it squiggles a little and the plummets back to the x axis and then squiggles a little and then takes a drastically positive slope almost to the top of the graph where is squiggles a tiny bit before running of the graph.  The second graph is labeled b. Length-201 Multiband FIR Filter. The graph is similar to the first graph but every place where there was squiggling the area is now a flat horizontal line. The bottom left graph is the most complicated of the four graphs. It is labeled c. Multiband Filter Zero Locations. the x axis is labeled Real Part of Z, and the y axis is labeled the Imaginary Part of z. In general this image consist of a large circle centered on the origin with little hollow circles in, on and around it. There three distinct areas around the perimeter of the circle where there are little hollow circles present on the perimeter of the circle. On the left hand side there are two groups of circles: one at the center of the bottom left quarter of the circle and then another at the center of the top left quarter of the circle. The other group is on the center of the right half of the circle. All of these circle groups consist of overlapping little circles. The two on the left half are groups of four circles and the one on the right half consist of 12 little circles. There are also little circles present inside the larger circle. There are three circles grouped together to the right of the left most area of the larger circle. There are six grouped together between the top left grouping of perimeter circles and the right half group and the same grouping mirror between the bottom left group of perimeter circles and the right group. There are also little circle on the outside of the larger circle. There are three to the left of the far left of the circle. There are also two groups of six circles above and below the top and bottom extremes of the circle. The final graph is more similar to first two graphs. It is labeled d. Multiband, Multitype FIR Filter. It consist of a waveform that has an extremely positive slope to begin with which peaks at (.25,1) and then immediately takes an equally negative slope down to the x axis. The wave then wavers a little along the x axis and then shoots straight up to the same peak as before and wavers a bit and then falls back the x axis wavers and repeats.
Frequency Response and Zero Locations of FIR Filters Designed by Least Squared Error

Weighted least integral squares fir filter design

If the FIR filter design problem is posed as a weighted integral squared error approximation problem, a simple analytical design formula as in [link] or [link] is not possible (Recall that it is possible to easily introduce weights in the discrete approximation problem [link] ). In this section we consider a multiband generalization [link] of an approach which is a mixture of analytical formulas and numerical solution of Toeplitz plus Hankel matrices which have beenpresented in [link] , [link] , [link] .

The most general definition of the linear phase weighted least squares FIR filter design problem [link] , [link] , [link] defines the error measure as in Equation 10 from Constrained Approximation and Mixed Criteria by

q = 1 π Ω W ( ω ) | A d ( ω ) - A ( ω ) | 2 d ω .

where Ω is the set of frequencies that contribute to the error.

We set up the conditions for minimizing the error in [link] for odd N by using the same approach used in [link] which substitutes

A ( ω ) = n = 0 M a ( n ) cos ( ω n )

from Equation 34 from FIR Digital Filters into [link] , differentiates q in respect to each a ( m ) , and then sets it equal to zero to give

1 π Ω W ( ω ) A d ( ω ) cos ( ω m ) d ω = n = 0 M a ( n ) 2 π Ω W ( ω ) cos ( ω n ) cos ( ω m ) d ω

where we can obtain the h ( n ) from the a ( n ) by the scaling and shifting in Equation 35 from FIR Digital Filters . We denote this in matrix form by

Questions & Answers

how does Neisseria cause meningitis
Nyibol Reply
what is microbiologist
Muhammad Reply
what is errata
Muhammad
is the branch of biology that deals with the study of microorganisms.
Ntefuni Reply
What is microbiology
Mercy Reply
studies of microbes
Louisiaste
when we takee the specimen which lumbar,spin,
Ziyad Reply
How bacteria create energy to survive?
Muhamad Reply
Bacteria doesn't produce energy they are dependent upon their substrate in case of lack of nutrients they are able to make spores which helps them to sustain in harsh environments
_Adnan
But not all bacteria make spores, l mean Eukaryotic cells have Mitochondria which acts as powerhouse for them, since bacteria don't have it, what is the substitution for it?
Muhamad
they make spores
Louisiaste
what is sporadic nd endemic, epidemic
Aminu Reply
the significance of food webs for disease transmission
Abreham
food webs brings about an infection as an individual depends on number of diseased foods or carriers dully.
Mark
explain assimilatory nitrate reduction
Esinniobiwa Reply
Assimilatory nitrate reduction is a process that occurs in some microorganisms, such as bacteria and archaea, in which nitrate (NO3-) is reduced to nitrite (NO2-), and then further reduced to ammonia (NH3).
Elkana
This process is called assimilatory nitrate reduction because the nitrogen that is produced is incorporated in the cells of microorganisms where it can be used in the synthesis of amino acids and other nitrogen products
Elkana
Examples of thermophilic organisms
Shu Reply
Give Examples of thermophilic organisms
Shu
advantages of normal Flora to the host
Micheal Reply
Prevent foreign microbes to the host
Abubakar
they provide healthier benefits to their hosts
ayesha
They are friends to host only when Host immune system is strong and become enemies when the host immune system is weakened . very bad relationship!
Mark
what is cell
faisal Reply
cell is the smallest unit of life
Fauziya
cell is the smallest unit of life
Akanni
ok
Innocent
cell is the structural and functional unit of life
Hasan
is the fundamental units of Life
Musa
what are emergency diseases
Micheal Reply
There are nothing like emergency disease but there are some common medical emergency which can occur simultaneously like Bleeding,heart attack,Breathing difficulties,severe pain heart stock.Hope you will get my point .Have a nice day ❣️
_Adnan
define infection ,prevention and control
Innocent
I think infection prevention and control is the avoidance of all things we do that gives out break of infections and promotion of health practices that promote life
Lubega
Heyy Lubega hussein where are u from?
_Adnan
en français
Adama
which site have a normal flora
ESTHER Reply
Many sites of the body have it Skin Nasal cavity Oral cavity Gastro intestinal tract
Safaa
skin
Asiina
skin,Oral,Nasal,GIt
Sadik
How can Commensal can Bacteria change into pathogen?
Sadik
How can Commensal Bacteria change into pathogen?
Sadik
all
Tesfaye
by fussion
Asiina
what are the advantages of normal Flora to the host
Micheal
what are the ways of control and prevention of nosocomial infection in the hospital
Micheal
what is inflammation
Shelly Reply
part of a tissue or an organ being wounded or bruised.
Wilfred
what term is used to name and classify microorganisms?
Micheal Reply
Binomial nomenclature
adeolu
Got questions? Join the online conversation and get instant answers!
Jobilize.com Reply

Get Jobilize Job Search Mobile App in your pocket Now!

Get it on Google Play Download on the App Store Now


Source:  OpenStax, Digital signal processing and digital filter design (draft). OpenStax CNX. Nov 17, 2012 Download for free at http://cnx.org/content/col10598/1.6
Google Play and the Google Play logo are trademarks of Google Inc.

Notification Switch

Would you like to follow the 'Digital signal processing and digital filter design (draft)' conversation and receive update notifications?

Ask