<< Chapter < Page Chapter >> Page >
h ^ d ( n ) = sin ( ω 0 n ) π n sin ( Δ n / p ) Δ n / p p

where ω 0 = ( ω s + ω p ) / 2 is the average band edge and Δ = ( ω s - ω p ) / 2 is half the transition band width in radians per second normalized for one sample persecond sampling rate [link] , [link] , [link] . The spline produces a transition function which consists of p segments of p t h order polynomials connected together so that p - 1 derivatives are continuous at the junctions.
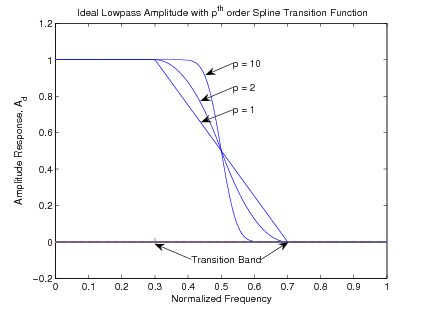
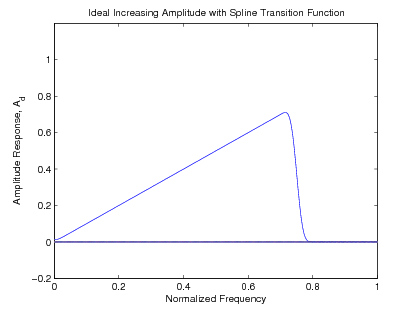
This graph is labeled Ideal Lowpass Filter Amplitude with Order-p Spline Transition Function. The x axis is labeled Normalized frequency and the y axis is labeled Amplitude Response, A_d. At y=0 there is another line running the length of the graph. The segment of the line between (.3,0) to (.7,0) is labeled Transition Band. This graph consist of three different lines all originating at (0,1). All three of the lines start out as horizontal lines. The first line to deviate from this path is labeled p=1 and  at the point where the Transition Band starts to where it ends the line takes a negative diagonal slope. The next line to deviate from the initial horizontal path is labeled p=2, and when it reaches the area of the transition band, the line takes a gentle negative slope and then ends by curving to the right before reaching the x axis. The final line labeled P=10. This line follows the initial horizontal path the longest and then takes the most drastic negative slope of the three down (almost a vertical line) and then curves to the right just a little before ending on the x axis.
Ideal Lowpass Filter Amplitude with Order-p Spline Transition Function

The optimal value of the exponent p is chosen as p = 0 . 624 ( f s - f p ) N (for a unity sampling rate) which minimizes the approximation error [link] . Each of the four ideal lowpass filters derived in the previous can have a transition band addedsimply by multiplying their impulse response by the sinc weighting function as illustrated in [link] . [link] shows an ideal unity gain filter amplitude response with examples of first,second, and tenth order spline transition functions. [link] shows the ideal responses of the linear gain filter with fourth order spline transition function.

The graph is labeled Ideal Increasing Amplitude with Spline Transition Function. The x axis is labeled Normalized Frequency and the y axis is Amplitude Response. The graph consist of a line extending from the origin with a positive slope and then the line proceeds straight down at about x=.75. Right before reaching the x axis the vertical line curves a little to the right just before (.8,0).
Ideal Increasing Amplitude Filter with Spline Transition Function

The optimal multiband least squared error design method

The optimal multiband design method consists of two somewhat independent parts. The first is the design of an optimal least squares lowpass filterwith a transition band as described above or as calculated by an inverse FFT. The second part builds an optimal multiband filter from acombination of these optimal lowpass filters and is the main point of this [link] .

The unweighted least squared error linear phase FIR filter design problem is to find the filter coefficients that minimize the error defined by

q = 0 π | A ( ω ) - A d ( ω ) | 2 d ω

where A ( ω ) is the amplitude frequency response of the actual filter and A d ( ω ) is the desired ideal amplitude response. This is done by truncating the inverse discrete time Fourier transform of A d ( ω ) . The difficulty is the analytical evaluation of the integral in the inverse transform [link] . If a spline transition function is used, an analytical formula can be derived for the filter thatminimizes [link] . The details of this result can be found in [link] , [link] .

The infinitely long filters designed from the inverse discrete time Fourier transform of the ideal response have a frequency response which isthe same as the ideal and, therefore, has no error. An ideal desired amplitude response can be formulated as the sum of simpler ideal lowpassfilters, differentiators or Hilbert transformers together with their spline transition functions by

A d ( ω ) = k K k A d k ( ω ) .

where A d k ( ω ) is the desired lowpass response with a transition band in the k t h band such as given in [link] or [link] and the K k are chosen to build the desired A d ( ω ) . These A d k are the forms considered in the previous section along with any others that have analytical inverse DTFTs such as polynomials. Because of thelinearity of the Fourier transform, a multiband ideal response can be constructed by simply adding and subtracting the impulse response ofappropriate ideal lowpass filters.

h ^ d ( n ) = k K k IDTFT { A d k ( ω ) }
h ^ d ( n ) = k K k h ^ d k ( n )

Because of the orthogonality of the basis functions of the Fourier transform, the truncated sequence of the infinitely long impulse response h ^ d ( n ) will give an optimal approximation to A d ( ω ) in a least squares sense. This argument allows no error weighting or “don'tcare" transition bands or traditional windowing methods. It does, however, allow the optimized spline transition functions [link] , [link] .

Questions & Answers

what is biology
Hajah Reply
the study of living organisms and their interactions with one another and their environments
AI-Robot
what is biology
Victoria Reply
HOW CAN MAN ORGAN FUNCTION
Alfred Reply
the diagram of the digestive system
Assiatu Reply
allimentary cannel
Ogenrwot
How does twins formed
William Reply
They formed in two ways first when one sperm and one egg are splited by mitosis or two sperm and two eggs join together
Oluwatobi
what is genetics
Josephine Reply
Genetics is the study of heredity
Misack
how does twins formed?
Misack
What is manual
Hassan Reply
discuss biological phenomenon and provide pieces of evidence to show that it was responsible for the formation of eukaryotic organelles
Joseph Reply
what is biology
Yousuf Reply
the study of living organisms and their interactions with one another and their environment.
Wine
discuss the biological phenomenon and provide pieces of evidence to show that it was responsible for the formation of eukaryotic organelles in an essay form
Joseph Reply
what is the blood cells
Shaker Reply
list any five characteristics of the blood cells
Shaker
lack electricity and its more savely than electronic microscope because its naturally by using of light
Abdullahi Reply
advantage of electronic microscope is easily and clearly while disadvantage is dangerous because its electronic. advantage of light microscope is savely and naturally by sun while disadvantage is not easily,means its not sharp and not clear
Abdullahi
cell theory state that every organisms composed of one or more cell,cell is the basic unit of life
Abdullahi
is like gone fail us
DENG
cells is the basic structure and functions of all living things
Ramadan
What is classification
ISCONT Reply
is organisms that are similar into groups called tara
Yamosa
in what situation (s) would be the use of a scanning electron microscope be ideal and why?
Kenna Reply
A scanning electron microscope (SEM) is ideal for situations requiring high-resolution imaging of surfaces. It is commonly used in materials science, biology, and geology to examine the topography and composition of samples at a nanoscale level. SEM is particularly useful for studying fine details,
Hilary
cell is the building block of life.
Condoleezza Reply
Got questions? Join the online conversation and get instant answers!
Jobilize.com Reply

Get Jobilize Job Search Mobile App in your pocket Now!

Get it on Google Play Download on the App Store Now


Source:  OpenStax, Digital signal processing and digital filter design (draft). OpenStax CNX. Nov 17, 2012 Download for free at http://cnx.org/content/col10598/1.6
Google Play and the Google Play logo are trademarks of Google Inc.

Notification Switch

Would you like to follow the 'Digital signal processing and digital filter design (draft)' conversation and receive update notifications?

Ask