<< Chapter < Page Chapter >> Page >

Measuring microbial control

Physical and chemical methods of microbial control that kill the targeted microorganism are identified by the suffix -cide (or -cidal ). The prefix indicates the type of microbe or infectious agent killed by the treatment method: bactericide s kill bacteria, viricide s kill or inactivate viruses, and fungicide s kill fungi. Other methods do not kill organisms but, instead, stop their growth, making their population static; such methods are identified by the suffix -stat (or -static ). For example, bacteriostatic treatments inhibit the growth of bacteria, whereas fungistatic treatments inhibit the growth of fungi. Factors that determine whether a particular treatment is -cidal or -static include the types of microorganisms targeted, the concentration of the chemical used, and the nature of the treatment applied.

Although -static treatments do not actually kill infectious agents, they are often less toxic to humans and other animals, and may also better preserve the integrity of the item treated. Such treatments are typically sufficient to keep the microbial population of an item in check. The reduced toxicity of some of these -static chemicals also allows them to be impregnated safely into plastics to prevent the growth of microbes on these surfaces. Such plastics are used in products such as toys for children and cutting boards for food preparation. When used to treat an infection, -static treatments are typically sufficient in an otherwise healthy individual, preventing the pathogen from multiplying, thus allowing the individual’s immune system to clear the infection.

The degree of microbial control can be evaluated using a microbial death curve to describe the progress and effectiveness of a particular protocol. When exposed to a particular microbial control protocol, a fixed percentage of the microbes within the population will die. Because the rate of killing remains constant even when the population size varies, the percentage killed is more useful information than the absolute number of microbes killed. Death curves are often plotted as semilog plots just like microbial growth curves because the reduction in microorganisms is typically logarithmic ( [link] ). The amount of time it takes for a specific protocol to produce a one order-of-magnitude decrease in the number of organisms, or the death of 90% of the population, is called the decimal reduction time (DRT) or D-value .

A table showing a decrease in number as microbial cells die. At time 0 there are 10 to the 10 cells. At time 5 there are 10 to the 9 cells. At time 10 there are 10 to the 8 cells.  At time 15there are 10 to the 7 cells. At time 20 there are 10 to the 6 cells. At time 25 there are 10 to the 5 cells. At time 30 there are 10 to the 4 cells. At time 35 there are 10 to the 3 cells. At time 40 there are 10 to the 2 cells. At time 45 there are 10 to the 1 cells. At time 50 there are 10 to the 0 cells. A graph titled microbial death curve. The X axis is time and the Y axis is number of cells. Two lines indicate what this graph looks like using an arithmetic and logarithmic scale. Both lines begin at 10 to the 10 at time 0. The arithmetic scale drops quickly and is indistinguishable from 0 by 10 minutes. The logarithmic scale slopes at a clean diagonal. The D value is shown as the time it takes to move from 10 to the 6 to 10 to the 5; this occurs in 5 minutes.
Microbial death is logarithmic and easily observed using a semilog plot instead of an arithmetic one. The decimal reduction time (D-value) is the time it takes to kill 90% of the population (a 1-log decrease in the total population) when exposed to a specific microbial control protocol, as indicated by the purple bracket.

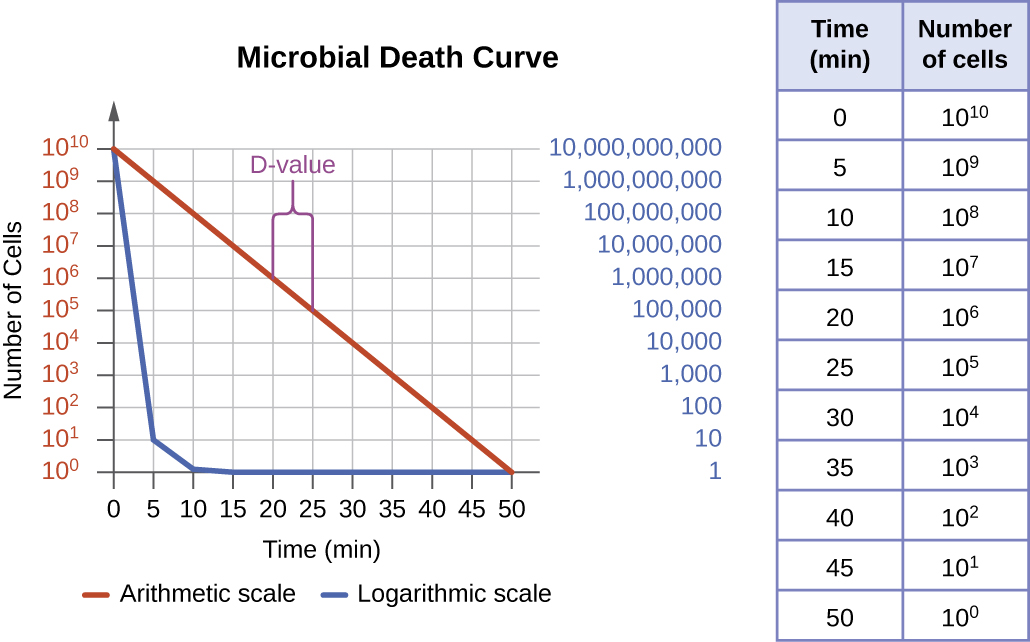
Several factors contribute to the effectiveness of a disinfecting agent or microbial control protocol. First, as demonstrated in [link] , the length of time of exposure is important. Longer exposure times kill more microbes. Because microbial death of a population exposed to a specific protocol is logarithmic, it takes longer to kill a high-population load than a low-population load exposed to the same protocol. A shorter treatment time (measured in multiples of the D-value) is needed when starting with a smaller number of organisms. Effectiveness also depends on the susceptibility of the agent to that disinfecting agent or protocol. The concentration of disinfecting agent or intensity of exposure is also important. For example, higher temperatures and higher concentrations of disinfectants kill microbes more quickly and effectively. Conditions that limit contact between the agent and the targeted cells cells—for example, the presence of bodily fluids, tissue, organic debris (e.g., mud or feces), or biofilm s on surfaces—increase the cleaning time or intensity of the microbial control protocol required to reach the desired level of cleanliness. All these factors must be considered when choosing the appropriate protocol to control microbial growth in a given situation.

Questions & Answers

differentiate between demand and supply giving examples
Lambiv Reply
differentiated between demand and supply using examples
Lambiv
what is labour ?
Lambiv
how will I do?
Venny Reply
how is the graph works?I don't fully understand
Rezat Reply
information
Eliyee
devaluation
Eliyee
t
WARKISA
hi guys good evening to all
Lambiv
multiple choice question
Aster Reply
appreciation
Eliyee
explain perfect market
Lindiwe Reply
In economics, a perfect market refers to a theoretical construct where all participants have perfect information, goods are homogenous, there are no barriers to entry or exit, and prices are determined solely by supply and demand. It's an idealized model used for analysis,
Ezea
What is ceteris paribus?
Shukri Reply
other things being equal
AI-Robot
When MP₁ becomes negative, TP start to decline. Extuples Suppose that the short-run production function of certain cut-flower firm is given by: Q=4KL-0.6K2 - 0.112 • Where is quantity of cut flower produced, I is labour input and K is fixed capital input (K-5). Determine the average product of lab
Kelo
Extuples Suppose that the short-run production function of certain cut-flower firm is given by: Q=4KL-0.6K2 - 0.112 • Where is quantity of cut flower produced, I is labour input and K is fixed capital input (K-5). Determine the average product of labour (APL) and marginal product of labour (MPL)
Kelo
yes,thank you
Shukri
Can I ask you other question?
Shukri
what is monopoly mean?
Habtamu Reply
What is different between quantity demand and demand?
Shukri Reply
Quantity demanded refers to the specific amount of a good or service that consumers are willing and able to purchase at a give price and within a specific time period. Demand, on the other hand, is a broader concept that encompasses the entire relationship between price and quantity demanded
Ezea
ok
Shukri
how do you save a country economic situation when it's falling apart
Lilia Reply
what is the difference between economic growth and development
Fiker Reply
Economic growth as an increase in the production and consumption of goods and services within an economy.but Economic development as a broader concept that encompasses not only economic growth but also social & human well being.
Shukri
production function means
Jabir
What do you think is more important to focus on when considering inequality ?
Abdisa Reply
any question about economics?
Awais Reply
sir...I just want to ask one question... Define the term contract curve? if you are free please help me to find this answer 🙏
Asui
it is a curve that we get after connecting the pareto optimal combinations of two consumers after their mutually beneficial trade offs
Awais
thank you so much 👍 sir
Asui
In economics, the contract curve refers to the set of points in an Edgeworth box diagram where both parties involved in a trade cannot be made better off without making one of them worse off. It represents the Pareto efficient allocations of goods between two individuals or entities, where neither p
Cornelius
In economics, the contract curve refers to the set of points in an Edgeworth box diagram where both parties involved in a trade cannot be made better off without making one of them worse off. It represents the Pareto efficient allocations of goods between two individuals or entities,
Cornelius
Suppose a consumer consuming two commodities X and Y has The following utility function u=X0.4 Y0.6. If the price of the X and Y are 2 and 3 respectively and income Constraint is birr 50. A,Calculate quantities of x and y which maximize utility. B,Calculate value of Lagrange multiplier. C,Calculate quantities of X and Y consumed with a given price. D,alculate optimum level of output .
Feyisa Reply
Answer
Feyisa
c
Jabir
the market for lemon has 10 potential consumers, each having an individual demand curve p=101-10Qi, where p is price in dollar's per cup and Qi is the number of cups demanded per week by the i th consumer.Find the market demand curve using algebra. Draw an individual demand curve and the market dema
Gsbwnw Reply
suppose the production function is given by ( L, K)=L¼K¾.assuming capital is fixed find APL and MPL. consider the following short run production function:Q=6L²-0.4L³ a) find the value of L that maximizes output b)find the value of L that maximizes marginal product
Abdureman
types of unemployment
Yomi Reply
What is the difference between perfect competition and monopolistic competition?
Mohammed
Got questions? Join the online conversation and get instant answers!
Jobilize.com Reply

Get Jobilize Job Search Mobile App in your pocket Now!

Get it on Google Play Download on the App Store Now


Source:  OpenStax, Microbiology. OpenStax CNX. Nov 01, 2016 Download for free at http://cnx.org/content/col12087/1.4
Google Play and the Google Play logo are trademarks of Google Inc.

Notification Switch

Would you like to follow the 'Microbiology' conversation and receive update notifications?

Ask