<< Chapter < Page
  Digital signal processing - dsp     Page 8 / 27
Chapter >> Page >

Two overloaded constructors

There are two overloaded versions of the constructor for the PlotALot01 class. One overloaded version accepts several incoming parameters allowing the user to control various aspects of the plotting format. (An example of the use of this constructor is shown in Figure 5 .) A second overloaded version accepts a title string only and sets all of theplotting parameters to default values. (An example of the use of this constructor is shown in Figure 1 .)

(You can easily modify the default values and recompile the class if you prefer different default values.)

Constructor parameters

The parameters for the version of the constructor that accepts plotting parameters are:

  • String title: Title for the Frame object. This title is concatenated with the page number and the result appears in the banner at the top of thePage as shown in Figure 1 .
  • int frameWidth: The Frame width in pixels.
  • int frameHeight: The Frame height in pixels.
  • int traceSpacing: Distance between trace axes in pixels.
  • int sampSpace: Number of pixels dedicated to each data sample in pixels per sample. (Must be 1 or greater.)
  • int ovalWidth: Width of an oval that is used to mark the sample value on the plot. (See Figure 5 for a good example of the ovals. Set the oval width and height parameters to zero to eliminate the ovals altogether.)
  • int ovalHeight: Height of an oval that is used to mark the sample value on the plot.

Two plotting objects for test purposes

For self-test purposes, the main method instantiates and feeds two independent plotting objects. Plotting parameters are specified for thefirst plotting object and the stack of pages for this plotting object is located 401 pixels to the right of the upper left corner of the screen. The outputproduced by this plotting object is shown in Figure 5 below. (The two pages in the screen shot in Figure 5 were manually relocated and positioned for reasons that I will explain later.)

Figure 5. Self-test output for PlotALot01.
Missing Figure.

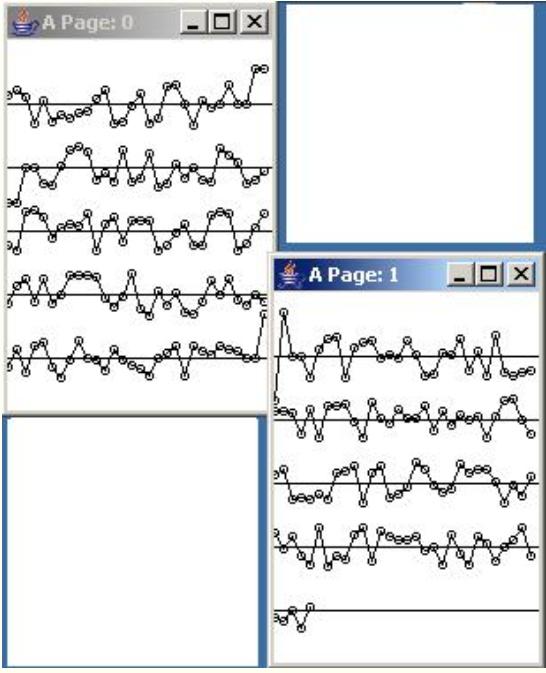
Default plotting parameters are used for the second plotting object and the stack of pages is located in the default location at the upper left corner ofthe screen. The output produced by this plotting object was shown earlier in Figure 1 .

The data to be plotted

Most of the data that is fed to each plotting object is white random noise produced by a random noise generator. However, fifteen of the data values fed tothe first plotting object are not random.

Transition from trace to trace on the same page

Eight of the data values for the first plotting object are set to 0,0,20,20,-20,-20,0,0. The result can be seen at the end of the first trace andthe beginning of the second trace in Page 0 in Figure 5 . Note that the last four plotted points for the first trace have values of 0,0,20, and 20. Then note thatthe first four plotted points on the second trace have values of -20, -20, 0, and 0. This confirms the proper transition from one trace to the next on thesame page with no loss of data values in the transition.

Transition from page to page

Seven of the values for the first plotting object are set to values of 0,0,25,-25,25,0,0. The result can be seen at the end of the last trace on Page 0and the beginning of the first trace on Page 1 in Figure 5 . Note that the last three plotted points in the last trace on Page 0 have values of 0, 0, and 25.Then note that the first four plotted points in the first trace on Page 1 have values of -25, 25, 0, and 0. This confirms the proper transition from one pageto the next with no loss of data in the transition.

Questions & Answers

differentiate between demand and supply giving examples
Lambiv Reply
differentiated between demand and supply using examples
Lambiv
what is labour ?
Lambiv
how will I do?
Venny Reply
how is the graph works?I don't fully understand
Rezat Reply
information
Eliyee
devaluation
Eliyee
t
WARKISA
hi guys good evening to all
Lambiv
multiple choice question
Aster Reply
appreciation
Eliyee
explain perfect market
Lindiwe Reply
In economics, a perfect market refers to a theoretical construct where all participants have perfect information, goods are homogenous, there are no barriers to entry or exit, and prices are determined solely by supply and demand. It's an idealized model used for analysis,
Ezea
What is ceteris paribus?
Shukri Reply
other things being equal
AI-Robot
When MP₁ becomes negative, TP start to decline. Extuples Suppose that the short-run production function of certain cut-flower firm is given by: Q=4KL-0.6K2 - 0.112 • Where is quantity of cut flower produced, I is labour input and K is fixed capital input (K-5). Determine the average product of lab
Kelo
Extuples Suppose that the short-run production function of certain cut-flower firm is given by: Q=4KL-0.6K2 - 0.112 • Where is quantity of cut flower produced, I is labour input and K is fixed capital input (K-5). Determine the average product of labour (APL) and marginal product of labour (MPL)
Kelo
yes,thank you
Shukri
Can I ask you other question?
Shukri
what is monopoly mean?
Habtamu Reply
What is different between quantity demand and demand?
Shukri Reply
Quantity demanded refers to the specific amount of a good or service that consumers are willing and able to purchase at a give price and within a specific time period. Demand, on the other hand, is a broader concept that encompasses the entire relationship between price and quantity demanded
Ezea
ok
Shukri
how do you save a country economic situation when it's falling apart
Lilia Reply
what is the difference between economic growth and development
Fiker Reply
Economic growth as an increase in the production and consumption of goods and services within an economy.but Economic development as a broader concept that encompasses not only economic growth but also social & human well being.
Shukri
production function means
Jabir
What do you think is more important to focus on when considering inequality ?
Abdisa Reply
any question about economics?
Awais Reply
sir...I just want to ask one question... Define the term contract curve? if you are free please help me to find this answer 🙏
Asui
it is a curve that we get after connecting the pareto optimal combinations of two consumers after their mutually beneficial trade offs
Awais
thank you so much 👍 sir
Asui
In economics, the contract curve refers to the set of points in an Edgeworth box diagram where both parties involved in a trade cannot be made better off without making one of them worse off. It represents the Pareto efficient allocations of goods between two individuals or entities, where neither p
Cornelius
In economics, the contract curve refers to the set of points in an Edgeworth box diagram where both parties involved in a trade cannot be made better off without making one of them worse off. It represents the Pareto efficient allocations of goods between two individuals or entities,
Cornelius
Suppose a consumer consuming two commodities X and Y has The following utility function u=X0.4 Y0.6. If the price of the X and Y are 2 and 3 respectively and income Constraint is birr 50. A,Calculate quantities of x and y which maximize utility. B,Calculate value of Lagrange multiplier. C,Calculate quantities of X and Y consumed with a given price. D,alculate optimum level of output .
Feyisa Reply
Answer
Feyisa
c
Jabir
the market for lemon has 10 potential consumers, each having an individual demand curve p=101-10Qi, where p is price in dollar's per cup and Qi is the number of cups demanded per week by the i th consumer.Find the market demand curve using algebra. Draw an individual demand curve and the market dema
Gsbwnw Reply
suppose the production function is given by ( L, K)=L¼K¾.assuming capital is fixed find APL and MPL. consider the following short run production function:Q=6L²-0.4L³ a) find the value of L that maximizes output b)find the value of L that maximizes marginal product
Abdureman
types of unemployment
Yomi Reply
What is the difference between perfect competition and monopolistic competition?
Mohammed
Got questions? Join the online conversation and get instant answers!
Jobilize.com Reply

Get Jobilize Job Search Mobile App in your pocket Now!

Get it on Google Play Download on the App Store Now


Source:  OpenStax, Digital signal processing - dsp. OpenStax CNX. Jan 06, 2016 Download for free at https://legacy.cnx.org/content/col11642/1.38
Google Play and the Google Play logo are trademarks of Google Inc.

Notification Switch

Would you like to follow the 'Digital signal processing - dsp' conversation and receive update notifications?

Ask