| << Chapter < Page | Chapter >> Page > |
This class defines the methods declared in the interface, and makes it possible to test the plotting program in a stand-alone mode without havingaccess to another class that implements the interface.
Since I discussed the implementation of this interface in some detail earlier in the module, there should be no need for me to provide further discussion ofthe code in Listing 36 . You might note, however, that since the method named getNmbr returns the value 4, the method named f5 will not be called by the plotting program.
Figure 4 shows the type of output produced by this self-test class.
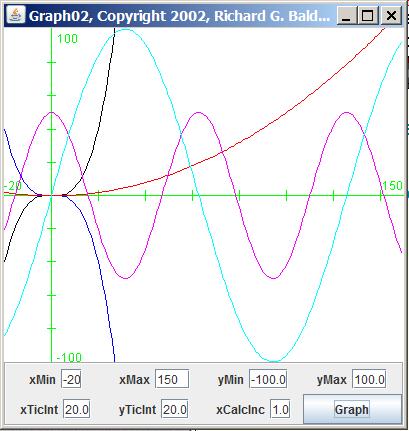
As I mentioned earlier, the program named Graph02 , shown in Listing 40 , can also be used to plot as many as five separate functions. The graphs produced by the functions are superimposed in the same plotting area.This is simply an alternative display format. A sample output from Graph02 is shown in Figure 5 .
| Figure 5. Sample output format from Graph02. |
|---|
 |
Because of the similarity of this program to Graph01 , I won't discuss any of the particulars of this program. If you understand the program named Graph01 , you should have no difficulty understanding the program named Graph02 as well.
Copy the code for the plotting program from Listing 39 into a Java source file named Graph01.java .
Copy the code for the interface from Listing 1 into a Java source file named GraphIntfc01.java .
Compile and run the program named Graph01 with no command-line arguments. This should use the internal test class named junk discussed earlier to produce a display similar to that shown in Figure 4 .
Once you have the display on your screen, make changes to the plotting parameters in the text fields at the bottom and press the button labeled Graph . When you do, you should see the same functions being re-plotted with different plotting parameters.
Once that is successful, copy the code in Listing 37 into a file named Graph01Demo.java . Copy the code in Listing 38 into a file named Dsp002.java .
Compile these two files. Rerun the plotting program named Graph01 providing Graph01Demo as a command-line argument. Also rerun the plotting program providing Dsp002 as a command-line argument. This should produce displays similar to Figure 1 and Figure 3 . (You may need to adjust some of the plotting parameters at the bottom to make them match. Also remember that Figure 3 was produced using random data so it won't be possible to match it exactly.)
You must be running Java version 1.4 or later to successfully compile and execute this program.
I provided two generalized plotting programs in this module. One of the programs plots up to five functions in a vertical stack. The other programsuperimposes the plots for up to five functions on the same Cartesian coordinate system.
Each of these programs is capable of plotting the data produced by any object that implements a simple interface named GraphIntfc01 .
I explained the interface named GraphIntfc01 . I also explained how you can define classes of your own that implement the interfacemaking them suitable for being plotted using either of the plotting programs.

Notification Switch
Would you like to follow the 'Digital signal processing - dsp' conversation and receive update notifications?