<< Chapter < Page
  Digital signal processing - dsp     Page 23 / 25
Chapter >> Page >

This class defines the methods declared in the interface, and makes it possible to test the plotting program in a stand-alone mode without havingaccess to another class that implements the interface.

Since I discussed the implementation of this interface in some detail earlier in the module, there should be no need for me to provide further discussion ofthe code in Listing 36 . You might note, however, that since the method named getNmbr returns the value 4, the method named f5 will not be called by the plotting program.

Figure 4 shows the type of output produced by this self-test class.

The program named Graph02

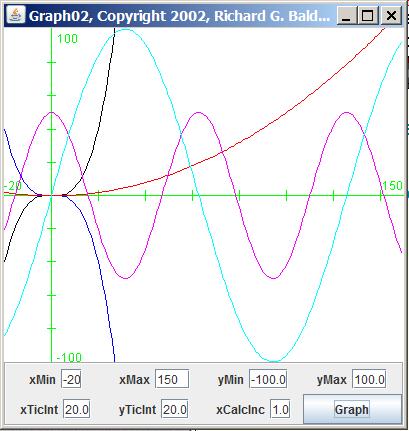
As I mentioned earlier, the program named Graph02 , shown in Listing 40 , can also be used to plot as many as five separate functions. The graphs produced by the functions are superimposed in the same plotting area.This is simply an alternative display format. A sample output from Graph02 is shown in Figure 5 .

Figure 5. Sample output format from Graph02.
missing image

Because of the similarity of this program to Graph01 , I won't discuss any of the particulars of this program. If you understand the program named Graph01 , you should have no difficulty understanding the program named Graph02 as well.

Run the program

Copy the code for the plotting program from Listing 39 into a Java source file named Graph01.java .

Copy the code for the interface from Listing 1 into a Java source file named GraphIntfc01.java .

Compile and run the program named Graph01 with no command-line arguments. This should use the internal test class named junk discussed earlier to produce a display similar to that shown in Figure 4 .

Once you have the display on your screen, make changes to the plotting parameters in the text fields at the bottom and press the button labeled Graph . When you do, you should see the same functions being re-plotted with different plotting parameters.

Once that is successful, copy the code in Listing 37 into a file named Graph01Demo.java . Copy the code in Listing 38 into a file named Dsp002.java .

Compile these two files. Rerun the plotting program named Graph01 providing Graph01Demo as a command-line argument. Also rerun the plotting program providing Dsp002 as a command-line argument. This should produce displays similar to Figure 1 and Figure 3 . (You may need to adjust some of the plotting parameters at the bottom to make them match. Also remember that Figure 3 was produced using random data so it won't be possible to match it exactly.)

You must be running Java version 1.4 or later to successfully compile and execute this program.

Summary

I provided two generalized plotting programs in this module. One of the programs plots up to five functions in a vertical stack. The other programsuperimposes the plots for up to five functions on the same Cartesian coordinate system.

Each of these programs is capable of plotting the data produced by any object that implements a simple interface named GraphIntfc01 .

I explained the interface named GraphIntfc01 . I also explained how you can define classes of your own that implement the interfacemaking them suitable for being plotted using either of the plotting programs.

Questions & Answers

it is the relatively stable flow of income
Chidubem Reply
what is circular flow of income
Divine Reply
branches of macroeconomics
SHEDRACK Reply
what is Flexible exchang rate?
poudel Reply
is gdp a reliable measurement of wealth
Atega Reply
introduction to econometrics
Husseini Reply
Hi
mostafa
hi
LEMLEM
hello
Sammol
hi
Mahesh
bi
Ruqayat
hi
Ruqayat
Hi fellas
Nyawa
hey
Sammol
hi
God
hello
Jahara
Good morning
Jorge
hi
abubakar
hi
Nmesoma
hi
Mahesh
Hi
Tom
Why is unemployment rate never zero at full employment?
Priyanka Reply
bcoz of existence of frictional unemployment in our economy.
Umashankar
what is flexible exchang rate?
poudel
due to existence of the pple with disabilities
Abdulraufu
the demand of a good rises, causing the demand for another good to fall
Rushawn Reply
is it possible to leave every good at the same level
Joseph
I don't think so. because check it, if the demand for chicken increases, people will no longer consume fish like they used to causing a fall in the demand for fish
Anuolu
is not really possible to let the value of a goods to be same at the same time.....
Salome
Suppose the inflation rate is 6%, does it mean that all the goods you purchase will cost 6% more than previous year? Provide with reasoning.
Geetha Reply
Not necessarily. To measure the inflation rate economists normally use an averaged price index of a basket of certain goods. So if you purchase goods included in the basket, you will notice that you pay 6% more, otherwise not necessarily.
Waeth
discus major problems of macroeconomics
Alii Reply
what is the problem of macroeconomics
Yoal
Economic growth Stable prices and low unemployment
Ephraim
explain inflationcause and itis degre
Miresa Reply
what is inflation
Getu
increase in general price levels
WEETO
Good day How do I calculate this question: C= 100+5yd G= 2000 T= 2000 I(planned)=200. Suppose the actual output is 3000. What is the level of planned expenditures at this level of output?
Chisomo Reply
how to calculate actual output?
Chisomo
how to calculate the equilibrium income
Beshir
Criteria for determining money supply
Thapase Reply
who we can define macroeconomics in one line
Muhammad
Aggregate demand
Mohammed
C=k100 +9y and i=k50.calculate the equilibrium level of output
Mercy Reply
Hi
Isiaka
Hi
Geli
hy
Man
👋
Bahunda
hy how are you?
Man
ys
Amisha
how are you guys
Sekou
f9 guys
Amisha
how are you guys
Sekou
ys am also fine
Amisha
fine and you guys
Geli
from Nepal
Amisha
nawalparasi district from belatari
Amisha
nd u
Amisha
I am Camara from Guinea west Africa... happy to meet you guys here
Sekou
ma management ho
Amisha
ahile becheclor ho
Amisha
hjr ktm bta ho ani k kaam grnu hunxa tw
Amisha
belatari
Amisha
1st year ho
Amisha
nd u
Amisha
ahh
Amisha
kaha biratnagar
Amisha
ys
Amisha
kina k vo
Amisha
money as unit of account means what?
Kalombe
A unit of account is something that can be used to value goods and services and make calculations
Jim
all of you please speak in English I can't understand you're language
Muhammad
I want to know how can we define macroeconomics in one line
Muhammad
it must be .9 or 0.9 no Mpc is greater than 1 Y=100+.9Y+50 Y-.9Y=150 0.1Y/0.1=150/0.1 Y=1500
Kalombe
Mercy is it clear?😋
Kalombe
hi can someone help me on this question If a negative shocks shifts the IS curve to the left, what type of policy do you suggest so as to stabilize the level of output? discuss your answer using appropriate graph.
Galge Reply
if interest rate is increased this will will reduce the level of income shifting the curve to the left ◀️
Kalombe
Got questions? Join the online conversation and get instant answers!
Jobilize.com Reply

Get Jobilize Job Search Mobile App in your pocket Now!

Get it on Google Play Download on the App Store Now


Source:  OpenStax, Digital signal processing - dsp. OpenStax CNX. Jan 06, 2016 Download for free at https://legacy.cnx.org/content/col11642/1.38
Google Play and the Google Play logo are trademarks of Google Inc.

Notification Switch

Would you like to follow the 'Digital signal processing - dsp' conversation and receive update notifications?

Ask