

| << Chapter < Page | Chapter >> Page > |
The Traces per page specifies the number of horizontal axes on each page against which the data values are plotted.
The Samples per page gives the actual number of data values that are plotted on each page. This is determined from the values of Traces per page , Sample spacing , and Page width .
There are also two overloaded versions of the method named plotData . One version lets you specify the location of the upper left corner of the stackof pages relative to the upper left corner of the screen. The other version simply places the stack of pages in the upper left corner of the screen bydefault.
The class named PlotALot01 is designed for the plotting of large quantities of data from a single channel as described above. The classesnamed PlotALot02 and PlotALot03 are each designed to plot two channels of data. These two classes plot the two-channeldata in different formats.
The class named PlotALot02 provides all of the features described above for the class named PlotALot01 , such as overloaded constructors, overloaded plotData methods, etc. In addition, it provides the capability to superimpose two sets of data on the sameaxes with one set being plotted in black and the other being plotted in red. This is illustrated in Figure 2 .
| Figure 2. Sample output for PlotALot02 class. |
|---|
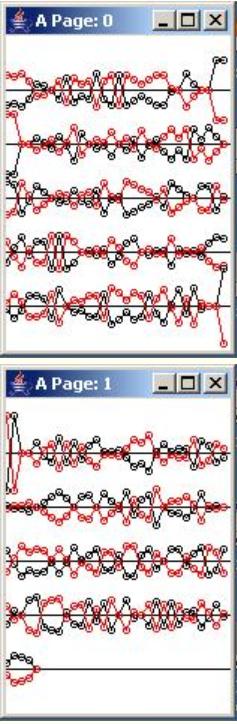 |
The plots in Figure 2 were produced by plotting two versions of the same data. The algebraic sign of each of the data values was inverted in one set ofdata relative to the other. Thus, the red plot in Figure 2 is an upside down version of the black plot. This makes it easy to confirm that both plottingprocesses are behaving the same way.
The plots in Figure 2 were produced using the version of the constructor that allows the user to control the plotting parameters. The overall plottingparameters for Figure 2 are shown below:
Title: A
Frame width: 158Frame height: 237
Page width: 150Page height: 210
Trace spacing: 36Sample spacing: 5
Traces per page: 5Samples per page: 150
As you can see, the ovals that were used to mark the sample values in Figure 2 were larger than in Figure 1 . With a height and a width of four pixels, each oval turned out to be a circle centered on the sample value.
Also, the horizontal scaling in Figure 2 was five pixels per sample as opposed to two pixels per sample in Figure 1 . As a result, the circles marking the samples were further apart, and the straight lines connecting the circlesare often visible.
The classes named PlotALot02 and PlotALot03 are each designed to plot two channels of data. These two classes plot the two-channel data in differentformats. Whereas PlotALot02 superimposes the two sets of data on the same horizontal axes using color to provide visual separation, PlotALot03 plots the two sets of data on alternating horizontal axes as shown in Figure 3 . PlotALot03 also uses color to provide visual separation between the two sets of data. Oneset is plotted on the odd numbered axes in black. The other set is plotted on the even numbered axes in red.
Notification Switch
Would you like to follow the 'Digital signal processing - dsp' conversation and receive update notifications?

|
|

|
|

|
|

|
|

|
|

|
|

|
|

|
|

|
|

|