<< Chapter < Page
  Digital signal processing - dsp     Page 6 / 27
Chapter >> Page >

The class named PlotALot03 also provides all of the general capabilities described earlier for the class named PlotALot01 that are appropriate for a two-channel plotting system.

Figure 3. Sample output for PlotALot03 class.
Missing Figure.

Same data, two colors

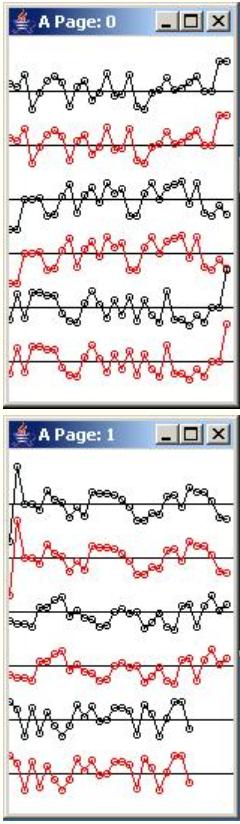
The two sets of data plotted in Figure 3 consisted of exactly the same values. Thus, the plots on the even numbered axes look just like the plots onthe odd numbered axes except that one plot is red and the other is black. Using the same values for each set of data makes it easy to confirm that both plottingprocesses are behaving the same way.

The plotting parameters

The overall plotting parameters for Figure 3 are shown below:

Title: A Frame width: 158Frame height: 270 Page width: 150Page height: 243 Trace spacing: 36Sample spacing: 5 Traces per page: 6Samples per page: 90

Because PlotALot03 doesn't superimpose the two sets of data, twice as many pages would be required for PlotALot03 to plot a given amount of data as would be required by PlotALot02 for the same Page size.

PlotALot03 will refuse to plot data for a set of plotting parameters that result in an odd number of traces on the page.

Sample output for PlotALot04 class

The class named PlotALot04 plots three sets of data on separate horizontal axes as shown in Figure 4 . The first set of data is plotted in black. The second set of data is plotted in red. The third set of data is plotted in blue. Thisclass is particularly useful for displaying the input, output, and error signals involved in adaptive signal processing, for example.

The class named PlotALot04 also provides all of the general capabilities described earlier for the class named PlotALot01 that are appropriate for a three-channel plotting system.

Figure 4. Sample output for PlotALot04 class.
Missing Figure.

Same data, three colors

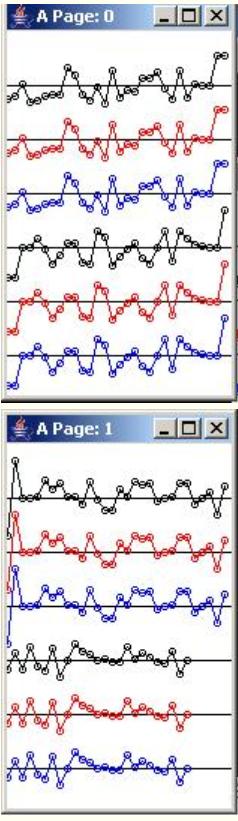
The three sets of data plotted in Figure 4 consisted of exactly the same values. Thus, the plots on the three different axes look just alike except thatthe first plot is black, the second plot is red and the third is blue. Using the same values for each set of data makes it easy to confirm that all threeplotting processes are behaving the same way.

The plotting parameters

The overall plotting parameters for Figure 4 are shown below:

Title: A Frame width: 158Frame height: 270 Page width: 150Page height: 243 Trace spacing: 36Sample spacing: 5 Traces per page: 6Samples per page: 60

PlotALot04 will terminate if the number of traces per page is not evenly divisible by 3

Sample programs

The class named PlotALot01

Now that you know where we are heading, it's time to examine these four classes in detail. I will begin with the class named PlotALot01 .

Purpose of the class

This class is designed to plot large amounts of data for a single channel. The class is particularly useful for plotting time series data. Also, bycarefully adjusting the plotting parameters, this class can be used to plot large quantities of spectral data in a waterfall display with each new spectral estimate being plotted immediately below the previous estimate.

Questions & Answers

how do you get the 2/50
Abba Reply
number of sport play by 50 student construct discrete data
Aminu Reply
width of the frangebany leaves on how to write a introduction
Theresa Reply
Solve the mean of variance
Veronica Reply
Step 1: Find the mean. To find the mean, add up all the scores, then divide them by the number of scores. ... Step 2: Find each score's deviation from the mean. ... Step 3: Square each deviation from the mean. ... Step 4: Find the sum of squares. ... Step 5: Divide the sum of squares by n – 1 or N.
kenneth
what is error
Yakuba Reply
Is mistake done to something
Vutshila
Hy
anas
hy
What is the life teble
anas
hy
Jibrin
statistics is the analyzing of data
Tajudeen Reply
what is statics?
Zelalem Reply
how do you calculate mean
Gloria Reply
diveving the sum if all values
Shaynaynay
let A1,A2 and A3 events be independent,show that (A1)^c, (A2)^c and (A3)^c are independent?
Fisaye Reply
what is statistics
Akhisani Reply
data collected all over the world
Shaynaynay
construct a less than and more than table
Imad Reply
The sample of 16 students is taken. The average age in the sample was 22 years with astandard deviation of 6 years. Construct a 95% confidence interval for the age of the population.
Aschalew Reply
Bhartdarshan' is an internet-based travel agency wherein customer can see videos of the cities they plant to visit. The number of hits daily is a normally distributed random variable with a mean of 10,000 and a standard deviation of 2,400 a. what is the probability of getting more than 12,000 hits? b. what is the probability of getting fewer than 9,000 hits?
Akshay Reply
Bhartdarshan'is an internet-based travel agency wherein customer can see videos of the cities they plan to visit. The number of hits daily is a normally distributed random variable with a mean of 10,000 and a standard deviation of 2,400. a. What is the probability of getting more than 12,000 hits
Akshay
1
Bright
Sorry i want to learn more about this question
Bright
Someone help
Bright
a= 0.20233 b=0.3384
Sufiyan
a
Shaynaynay
How do I interpret level of significance?
Mohd Reply
It depends on your business problem or in Machine Learning you could use ROC- AUC cruve to decide the threshold value
Shivam
how skewness and kurtosis are used in statistics
Owen Reply
yes what is it
Taneeya
Got questions? Join the online conversation and get instant answers!
Jobilize.com Reply

Get Jobilize Job Search Mobile App in your pocket Now!

Get it on Google Play Download on the App Store Now


Source:  OpenStax, Digital signal processing - dsp. OpenStax CNX. Jan 06, 2016 Download for free at https://legacy.cnx.org/content/col11642/1.38
Google Play and the Google Play logo are trademarks of Google Inc.

Notification Switch

Would you like to follow the 'Digital signal processing - dsp' conversation and receive update notifications?

Ask
Anonymous User
Start Quiz
Madison Christian
Start Quiz
Jordon Humphreys
Start Quiz
Edgar Delgado
Start Test
Rachel Carlisle
Start Quiz
Stephanie Redfern
Start Quiz
Dewey Compton
Start Exam