<< Chapter < Page
  Digital signal processing - dsp     Page 15 / 25
Chapter >> Page >

Usage instructions

At runtime, the name of the class that implements the GraphIntfc01 interface must be provided as a command-line argument.

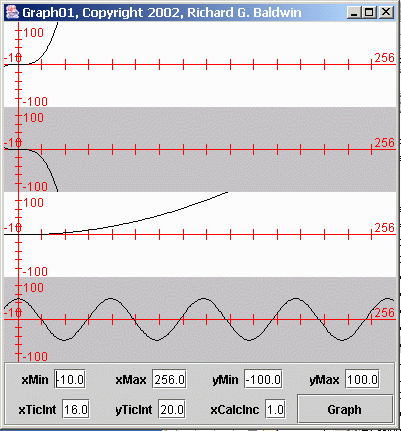
If the command-line argument is missing, the program instantiates an object from the internal test class named junk and plots the data produced by thatobject. Therefore, you can test the program by running it with no command-line arguments. This will produce the display shown in Figure 4 .

Figure 4. Graphic Display for Self-Test Class.
missing image

If the command-line argument is provided, the program instantiates an object of the class whose name matches the argument, and plots the data produced bythat object.

Plotting parameters

This program provides the following text fields for user input, along with a button labeled Graph . This allows the user to adjust the parameters and re-plot the graph as many times as needed with as many differentplotting scales as may be needed:

  • xMin = minimum x-axis value
  • xMax = maximum x-axis value
  • yMin = minimum y-axis value
  • yMax = maximum y-axis value
  • xTicInt = tic interval on x-axis
  • yTicInt = tic interval on y-axis
  • xCalcInc = calculation interval

The user can modify any of these parameters and then press the Graph button to cause the five functions to be re-plotted according to the newparameters.

A new object

Whenever the Graph button is pressed, the event handler for that button instantiates a new object of the class that implements the GraphIntfc01 interface.

Depending on the nature of that class, this may be redundant in some cases. However, it is useful in those cases where it is necessary to refresh the valuesof instance variables defined in the class (such as a counter, for example) .

(I will show you how to eliminate this feature from the plotting program if you decide that it is unnecessary for your data.)

Requires java sdk 1.4 or later

This program uses constants that were first defined in the Color class of v1.4.0. Therefore, the program requires v1.4.0 or later to compile andexecute correctly.

Will discuss in fragments

I will discuss this program in fragments. As mentioned earlier, a complete listing of the program is provided in Listing 39 near the end of the module. You should be able to copy and paste that code into your Java source file, and thencompile and execute it successfully.

The class named Graph01

The entire class, including the main method is shown in Listing 19 .

Listing 19. The class named Graph01.
import java.awt.*; import java.awt.event.*;import java.awt.geom.*; import javax.swing.*;import javax.swing.border.*; class Graph01{public static void main( String[]args) throws NoSuchMethodException,ClassNotFoundException, InstantiationException,IllegalAccessException{ if(args.length == 1){//pass command-line parameter new GUI(args[0]); }else{//no command-line parameter given new GUI(null);}//end else }// end main}//end class Graph01 definition

The primary purpose of main method is to instantiate an object of the class named GUI .

In addition, the main method checks to see if the user provided a command-line argument, and if so, passes it along to the constructorfor the GUI class.

Questions & Answers

Ayele, K., 2003. Introductory Economics, 3rd ed., Addis Ababa.
Widad Reply
can you send the book attached ?
Ariel
?
Ariel
What is economics
Widad Reply
the study of how humans make choices under conditions of scarcity
AI-Robot
U(x,y) = (x×y)1/2 find mu of x for y
Desalegn Reply
U(x,y) = (x×y)1/2 find mu of x for y
Desalegn
what is ecnomics
Jan Reply
this is the study of how the society manages it's scarce resources
Belonwu
what is macroeconomic
John Reply
macroeconomic is the branch of economics which studies actions, scale, activities and behaviour of the aggregate economy as a whole.
husaini
etc
husaini
difference between firm and industry
husaini Reply
what's the difference between a firm and an industry
Abdul
firm is the unit which transform inputs to output where as industry contain combination of firms with similar production 😅😅
Abdulraufu
Suppose the demand function that a firm faces shifted from Qd  120 3P to Qd  90  3P and the supply function has shifted from QS  20  2P to QS 10  2P . a) Find the effect of this change on price and quantity. b) Which of the changes in demand and supply is higher?
Toofiq Reply
explain standard reason why economic is a science
innocent Reply
factors influencing supply
Petrus Reply
what is economic.
Milan Reply
scares means__________________ends resources. unlimited
Jan
economics is a science that studies human behaviour as a relationship b/w ends and scares means which have alternative uses
Jan
calculate the profit maximizing for demand and supply
Zarshad Reply
Why qualify 28 supplies
Milan
what are explicit costs
Nomsa Reply
out-of-pocket costs for a firm, for example, payments for wages and salaries, rent, or materials
AI-Robot
concepts of supply in microeconomics
David Reply
economic overview notes
Amahle Reply
identify a demand and a supply curve
Salome Reply
i don't know
Parul
there's a difference
Aryan
Demand curve shows that how supply and others conditions affect on demand of a particular thing and what percent demand increase whith increase of supply of goods
Israr
Hi Sir please how do u calculate Cross elastic demand and income elastic demand?
Abari
Got questions? Join the online conversation and get instant answers!
Jobilize.com Reply

Get Jobilize Job Search Mobile App in your pocket Now!

Get it on Google Play Download on the App Store Now


Source:  OpenStax, Digital signal processing - dsp. OpenStax CNX. Jan 06, 2016 Download for free at https://legacy.cnx.org/content/col11642/1.38
Google Play and the Google Play logo are trademarks of Google Inc.

Notification Switch

Would you like to follow the 'Digital signal processing - dsp' conversation and receive update notifications?

Ask