| << Chapter < Page | Chapter >> Page > |
Now that we know how to calculate the limit of a vector-valued function, we can define continuity at a point for such a function.
Let f, g, and h be functions of t. Then, the vector-valued function is continuous at point if the following three conditions hold:
Similarly, the vector-valued function is continuous at point if the following three conditions hold:
Give the component functions and for the vector-valued function
Given find the following values (if possible).
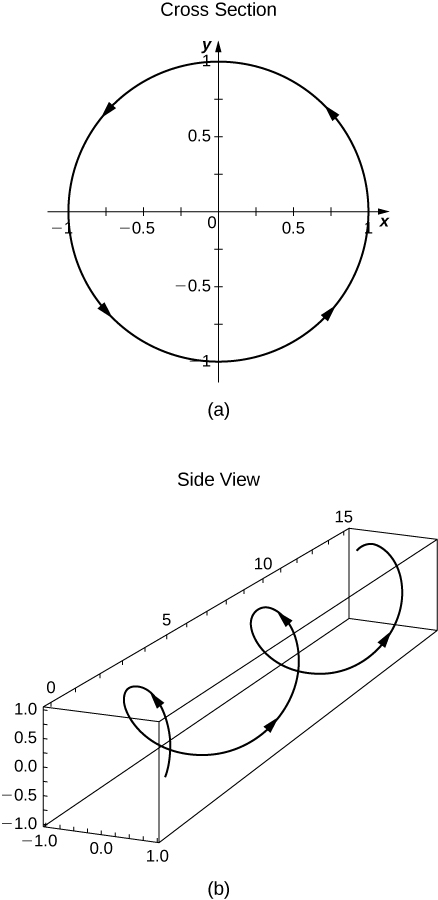
Sketch the curve of the vector-valued function and give the orientation of the curve. Sketch asymptotes as a guide to the graph.
Given the vector-valued function find the following values:
a.
b.
c. Yes, the limit as
t approaches
is equal to
d.
Given the vector-valued function find the following values:
Let Find the following values:
a. b. c. Yes
Find the limit of the following vector-valued functions at the indicated value of t .
for
The limit does not exist because the limit of as t approaches infinity does not exist.
Describe the curve defined by the vector-valued function
Find the domain of the vector-valued functions.
Let and use it to answer the following questions.
For what values of t is continuous?
Find the domain of
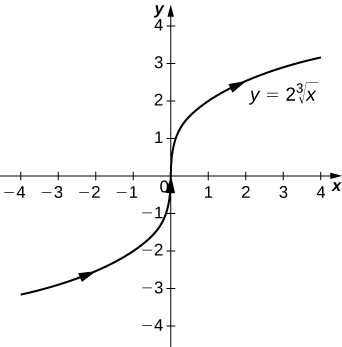
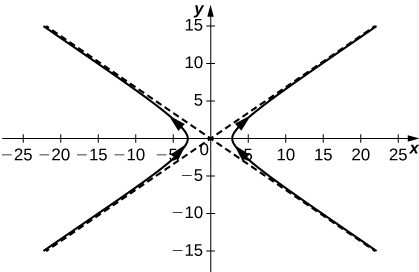
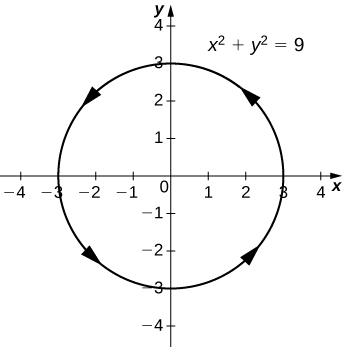
Eliminate the parameter t , write the equation in Cartesian coordinates, then sketch the graphs of the vector-valued functions. ( Hint: Let and Solve the first equation for x in terms of t and substitute this result into the second equation.)
a circle centered at
with radius 3, and a counterclockwise orientation
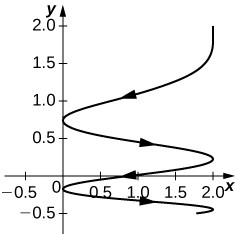
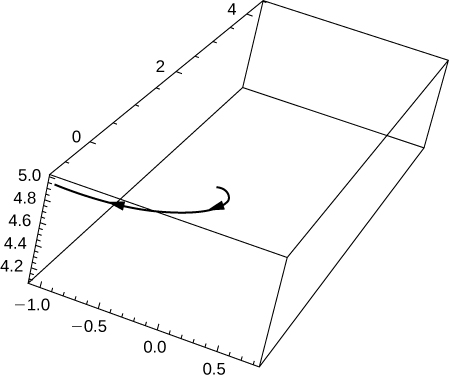
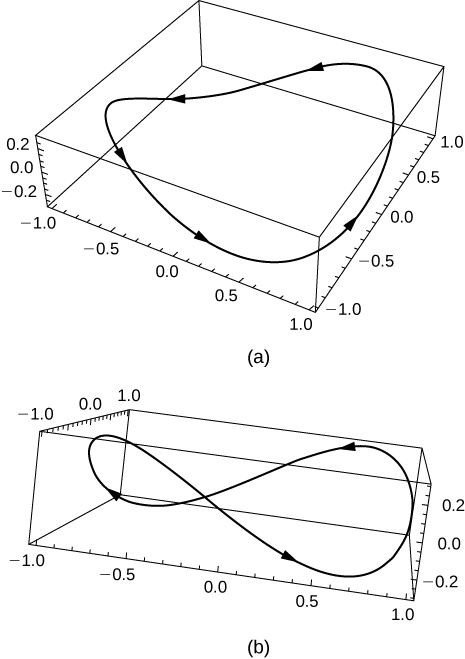
Use a graphing utility to sketch each of the following vector-valued functions:
[T]
Find a vector-valued function that traces out the given curve in the indicated direction.
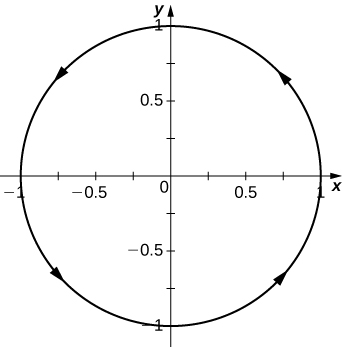
clockwise and counterclockwise
The line through P and Q where P is and Q is
Consider the curve described by the vector-valued function
Eliminate the parameter t to show that where
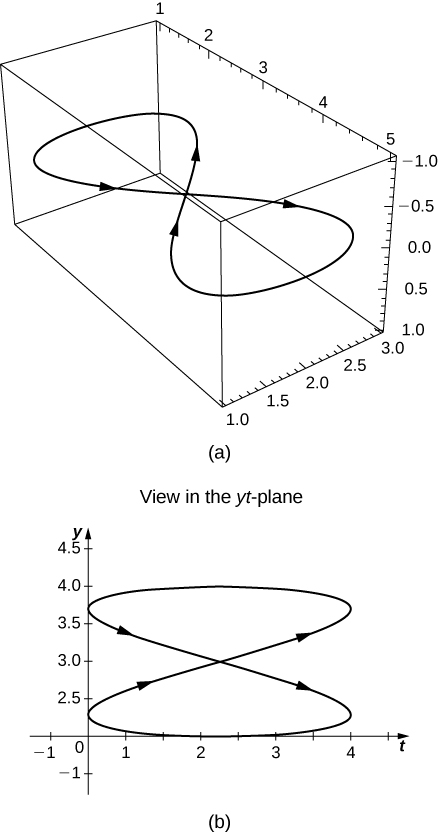
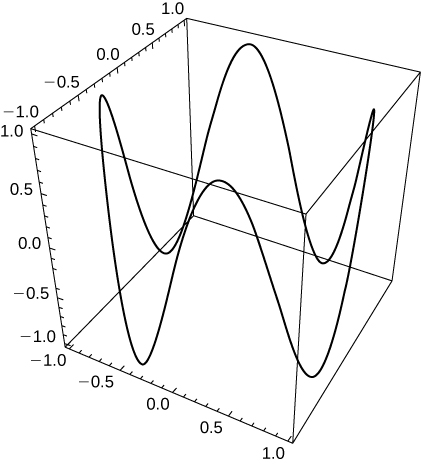
[T] Let Use technology to graph the curve (called the roller-coaster curve ) over the interval Choose at least two views to determine the peaks and valleys.
[T] Use the result of the preceding problem to construct an equation of a roller coaster with a steep drop from the peak and steep incline from the “valley.” Then, use technology to graph the equation.
Use the results of the preceding two problems to construct an equation of a path of a roller coaster with more than two turning points (peaks and valleys).
One possibility is
By increasing the coefficient of
t in the third component, the number of turning points will increase.
Notification Switch
Would you like to follow the 'Calculus volume 3' conversation and receive update notifications?

|
|

|
|

|
|

|
|

|
|

|
|

|
|

|
|

|
|

|