| << Chapter < Page | Chapter >> Page > |
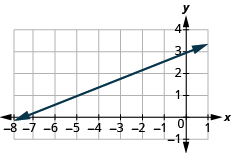
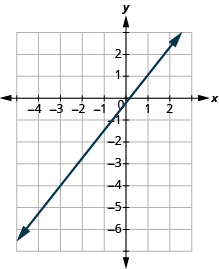
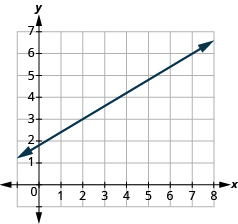
Find the slope of the line shown:

| Locate two points on the graph whose coordinates are integers. | and |
| Which point is on the left? | |
| Starting at , sketch a right angle to as shown below. |
 | |
| Count the rise – it is negative. | The rise is −2. |
| Count the run. | The run is 3. |
| Use the slope formula. | |
| Substitute the values of the rise and run. | |
| Simplify. | |
| The slope of the line is |
Notice that the slope is negative since the line slants downward from left to right.
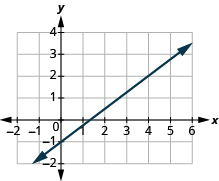
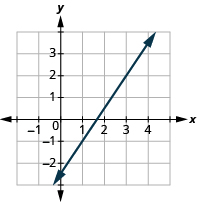
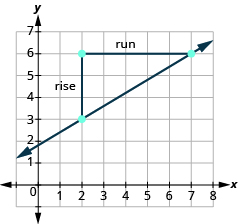
What if we had chosen different points? Let’s find the slope of the line again, this time using different points. We will use the points
and
Starting at
sketch a right triangle to
 | |
| Count the rise. | The rise is −6. |
| Count the run. | The run is 9. |
| Use the slope formula. | |
| Substitute the values of the rise and run. | |
| Simplify the fraction. | |
| The slope of the line is |
It does not matter which points you use—the slope of the line is always the same. The slope of a line is constant!
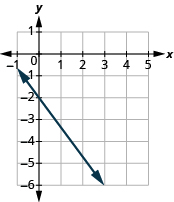
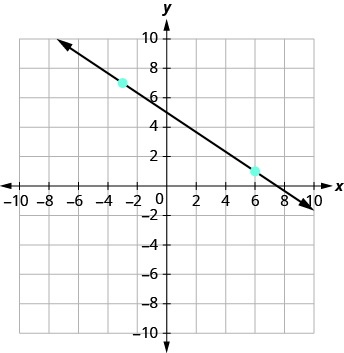
The lines in the previous examples had -intercepts with integer values, so it was convenient to use the y -intercept as one of the points we used to find the slope. In the next example, the -intercept is a fraction. The calculations are easier if we use two points with integer coordinates.
Find the slope of the line shown:
| Locate two points on the graph whose coordinates are integers. | and |
| Which point is on the left? | |
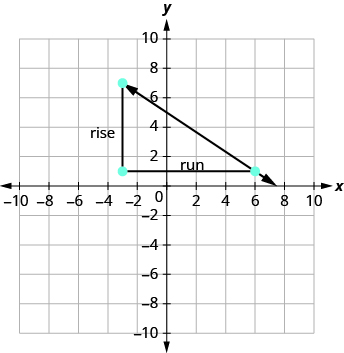
| Starting at , sketch a right angle to as shown below. |
 | |
| Count the rise. | The rise is 3. |
| Count the run. | The run is 5. |
| Use the slope formula. | |
| Substitute the values of the rise and run. | |
| The slope of the line is |
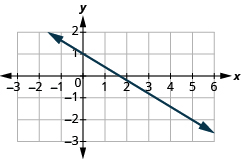
Do you remember what was special about horizontal and vertical lines? Their equations had just one variable.
So how do we find the slope of the horizontal line One approach would be to graph the horizontal line, find two points on it, and count the rise and the run. Let’s see what happens in [link] . We’ll use the two points and to count the rise and run.
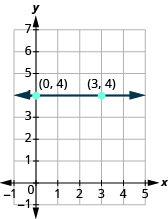
| What is the rise? | The rise is 0. |
| What is the run? | The run is 3. |
| What is the slope? | |
The slope of the horizontal line is
All horizontal lines have slope . When the -coordinates are the same, the rise is .
The slope of a horizontal line , is
Now we’ll consider a vertical line, such as the line , shown in [link] . We’ll use the two points and to count the rise and run.
Notification Switch
Would you like to follow the 'Prealgebra' conversation and receive update notifications?

|
|

|
|

|
|

|
|

|
|

|
|

|
|
|
|
|

|
|

|