<< Chapter < Page Chapter >> Page >

Estimating other functions

You may be pleasantly surprised to hear that any periodic function can be broken down into an infinite sum of sine and cosine waves. The elements of such a sum are together called a Fourier Series. The method for recovering the coefficients of the Fourier Series for any periodic function are the same as in equation [link] . Thus we create a function that will find the decomposition of any function. We do this in myfourier.m . The entire code is in the appendix, but it uses very similar ideas as in myfreq() (above).

function [freq mag] = myfourier(y, sr, use_fft, plot_on)(...some code skipped...) for n = 1 : numel(freq)    %obtain coefficient for freqency nth frequency [freq(n)]     sinmag(n) = mytrapz(t, y.*sin(freq(n)*2*pi*t), 1);    cosmag(n) = mytrapz(t, y.*cos(freq(n)*2*pi*t), 1); end

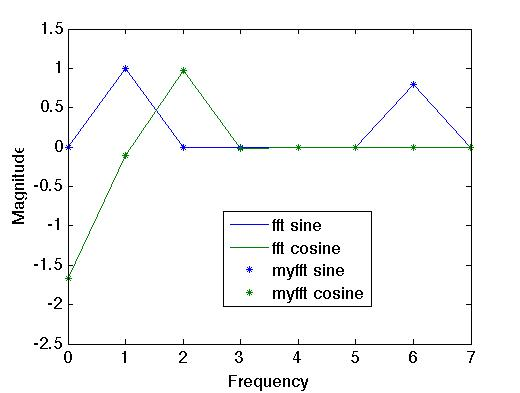
As a test, we compare the “answer" fft code with our own for an arbitrary function and find good agreement:

a dog on a bed
Comparison of myfft() to true frequencies.

Exercises

3.1 Suppose f = b 1 cos ( 1 * 2 π t ) + b 2 cos ( 2 * 2 π t ) + . Then prove Equation  [link] that helps recover the coefficients:

b j = 2 0 1 f ( t ) cos ( j · 2 π t ) d t

3.2 Suppose f is an infinite sum of sine and cosine waves:

f = sin ( 2 π t ) + sin ( 2 · 2 π t ) + + cos ( 2 π t ) + cos ( 2 · 2 π t ) +

Show that Equations [link] and [link] , which give expressions for a j and b j , are still valid.

Spectrogram applications to eeg

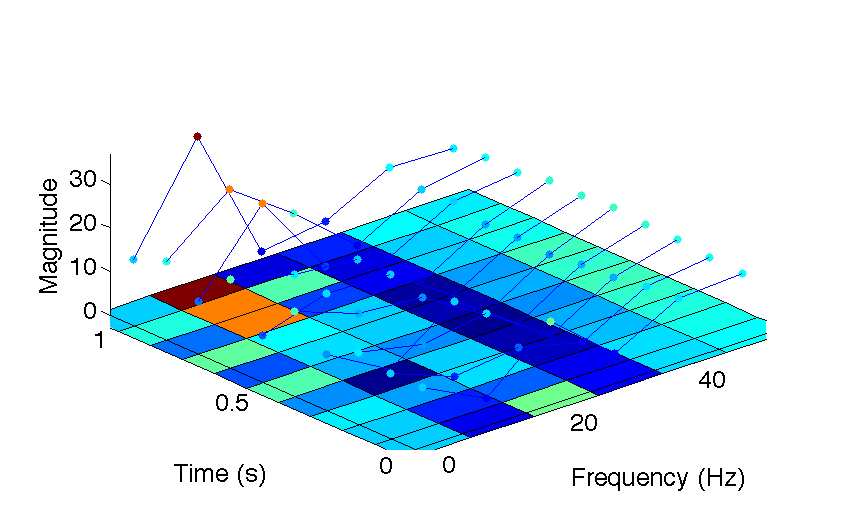
Here is the application we have been seeking the whole time. Given an EEG signal, we would like to find its corresponding Fourier series. We have just built up the tools to decompose the signal into component frequencies. This is useful, but the brain changes over time, and we want to be able to track changes in the signal over time. One way to do this is the spectrogram, or the short-term Fourier transform. It allows us to watch the way a signal changes over time.

Short-time fourier transform and the spectrogram

The idea behind the Short-time Fourier Transform is that we break up the signal into several time windows, then take the Fourier transform of each one of these. In Figure 10, we analyze the function f ( x ) = cos ( 4 · 2 π t ) + 3 cos ( 10 · 2 π t ) + 5 t 2 + 5 sin ( 35 · 2 π t ) from time t = 0 to t = 1 . First, we break it up into 10 segments of 100 ms each. Each segment corresponds to one block in the “Time" dimension. The line in that block is the amplitudes of sine and cosine waves from the Fourier transform of the function over that time window. The colors on the plane below it represent the amplitude of that frequency in that time interval. The higher the amplitude, the closer to red, and the lower, the closer to blue. The resulting image that we get is called a spectrogram .

a dog on a bed
Visual illustration of a spectrogram.

To code something like this, we consider each time window separately. This takes the form of a loop:

function [stft_plot freq tm] = my_stft(y, dt, win_len)(...some code skipped...) for n = 1:Nwindow    %isolate the part of the signal we want to deal with     sig_win = y((n-1)*win_len + 1 : n*win_len);

Within this window, we perform the Fourier Transform (using our homemade code!) and record it:

    %perform the fourier transform     [mg freq] = myfourier(sig_win, dt, 1);     sm(:,n) = mg(:,1);     cm(:,n) = mg(:,2);end

Questions & Answers

differentiate between demand and supply giving examples
Lambiv Reply
differentiated between demand and supply using examples
Lambiv
what is labour ?
Lambiv
how will I do?
Venny Reply
how is the graph works?I don't fully understand
Rezat Reply
information
Eliyee
devaluation
Eliyee
t
WARKISA
hi guys good evening to all
Lambiv
multiple choice question
Aster Reply
appreciation
Eliyee
explain perfect market
Lindiwe Reply
In economics, a perfect market refers to a theoretical construct where all participants have perfect information, goods are homogenous, there are no barriers to entry or exit, and prices are determined solely by supply and demand. It's an idealized model used for analysis,
Ezea
What is ceteris paribus?
Shukri Reply
other things being equal
AI-Robot
When MP₁ becomes negative, TP start to decline. Extuples Suppose that the short-run production function of certain cut-flower firm is given by: Q=4KL-0.6K2 - 0.112 • Where is quantity of cut flower produced, I is labour input and K is fixed capital input (K-5). Determine the average product of lab
Kelo
Extuples Suppose that the short-run production function of certain cut-flower firm is given by: Q=4KL-0.6K2 - 0.112 • Where is quantity of cut flower produced, I is labour input and K is fixed capital input (K-5). Determine the average product of labour (APL) and marginal product of labour (MPL)
Kelo
yes,thank you
Shukri
Can I ask you other question?
Shukri
what is monopoly mean?
Habtamu Reply
What is different between quantity demand and demand?
Shukri Reply
Quantity demanded refers to the specific amount of a good or service that consumers are willing and able to purchase at a give price and within a specific time period. Demand, on the other hand, is a broader concept that encompasses the entire relationship between price and quantity demanded
Ezea
ok
Shukri
how do you save a country economic situation when it's falling apart
Lilia Reply
what is the difference between economic growth and development
Fiker Reply
Economic growth as an increase in the production and consumption of goods and services within an economy.but Economic development as a broader concept that encompasses not only economic growth but also social & human well being.
Shukri
production function means
Jabir
What do you think is more important to focus on when considering inequality ?
Abdisa Reply
any question about economics?
Awais Reply
sir...I just want to ask one question... Define the term contract curve? if you are free please help me to find this answer 🙏
Asui
it is a curve that we get after connecting the pareto optimal combinations of two consumers after their mutually beneficial trade offs
Awais
thank you so much 👍 sir
Asui
In economics, the contract curve refers to the set of points in an Edgeworth box diagram where both parties involved in a trade cannot be made better off without making one of them worse off. It represents the Pareto efficient allocations of goods between two individuals or entities, where neither p
Cornelius
In economics, the contract curve refers to the set of points in an Edgeworth box diagram where both parties involved in a trade cannot be made better off without making one of them worse off. It represents the Pareto efficient allocations of goods between two individuals or entities,
Cornelius
Suppose a consumer consuming two commodities X and Y has The following utility function u=X0.4 Y0.6. If the price of the X and Y are 2 and 3 respectively and income Constraint is birr 50. A,Calculate quantities of x and y which maximize utility. B,Calculate value of Lagrange multiplier. C,Calculate quantities of X and Y consumed with a given price. D,alculate optimum level of output .
Feyisa Reply
Answer
Feyisa
c
Jabir
the market for lemon has 10 potential consumers, each having an individual demand curve p=101-10Qi, where p is price in dollar's per cup and Qi is the number of cups demanded per week by the i th consumer.Find the market demand curve using algebra. Draw an individual demand curve and the market dema
Gsbwnw Reply
suppose the production function is given by ( L, K)=L¼K¾.assuming capital is fixed find APL and MPL. consider the following short run production function:Q=6L²-0.4L³ a) find the value of L that maximizes output b)find the value of L that maximizes marginal product
Abdureman
types of unemployment
Yomi Reply
What is the difference between perfect competition and monopolistic competition?
Mohammed
Got questions? Join the online conversation and get instant answers!
Jobilize.com Reply

Get Jobilize Job Search Mobile App in your pocket Now!

Get it on Google Play Download on the App Store Now


Source:  OpenStax, The art of the pfug. OpenStax CNX. Jun 05, 2013 Download for free at http://cnx.org/content/col10523/1.34
Google Play and the Google Play logo are trademarks of Google Inc.

Notification Switch

Would you like to follow the 'The art of the pfug' conversation and receive update notifications?

Ask