

| << Chapter < Page | Chapter >> Page > |
Another way to test the general quality of the overall model is to test the coefficients as a group rather than independently. Because this is multiple regression (morethan one X), we use the F-test to determine if our coefficients collectively affect Y. The hypothesis is:
"at least one of the βi is not equal to 0"
If the null hypothesis cannot be rejected, then we conclude that none of the independent variables contribute to explaining the variation in Y. Reviewing [link] we see that SSR, the explained sum of squares, is a measure of just how much of the variation in Y is explained by all the variables in the model. SSE, the sum of theerrors squared, measures just how much is unexplained. It follows that the ratio of these two can provide us with a statistical test of the model as a whole.Remembering that the F distribution is a ratio of Chi squared distributions and that variances are distributed according to Chi Squared, and the sum of squared errorsand the sum of squares are both variances, we have the test statistic for this hypothesis as:
As with all our tests of hypothesis, we reach a conclusion by comparing the calculated F statistic with the critical value given our desired level of confidence. Ifthe calculated test statistic, an F statistic in this case, is in the tail of the distribution, then we cannot accept the null hypothesis. By not being able to accept the nullhypotheses we conclude that this specification of this model has validity, because at least one of the estimated coefficients is significantly different from zero.
An alternative way to reach this conclusion is to use the p-value comparison rule. The p-value is the area in the tail, given the calculated F statistic. In essence, thecomputer is finding the F value in the table for us. The computer regression output for the calculated F statistic is typically found in the ANOVA table section labeled“significance F. This is the probability of NOT accepting a false null hypothesis. If this probability is less than our pre-determined alpha error, then the conclusion isthat we cannot accept the null hypothesis.
Thus far the analysis of the OLS regression technique assumed that the independent variables in the models tested were continuous random variables. There are, however, no restrictions in the regression model against independent variables that are binary. This opens the regression model for testing hypotheses concerning categorical variables such as gender, race, region of the country, before a certain data, after a certain date and innumerable others. These categorical variables take on only two values, 0 and 1, success or failure, from the binomial probability distribution. The form of the equation becomes:
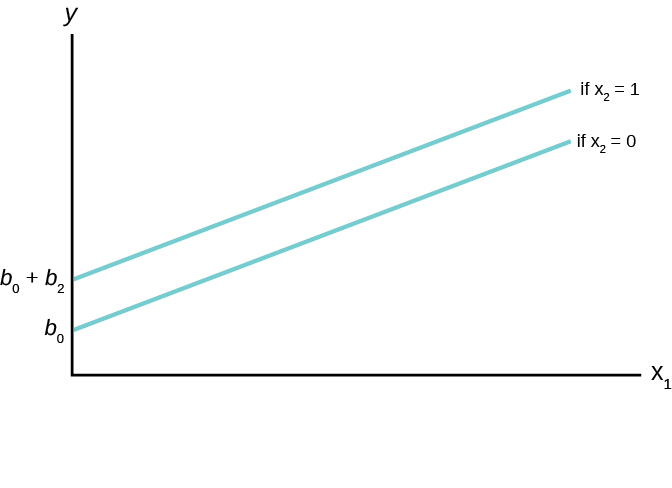
where . X 2 is the dummy variable and X 1 is some continuous random variable. The constant, b 0 , is the y-intercept, the value where the line crosses the y-axis. When the value of X 2 = 0, the estimated line crosses at b 0 . When the value of X 2 = 1 then the estimated line crosses at b 0 + b 2 . In effect of the dummy variable causes the estimated line to shift either up or down by the size of the effect of the characteristic captured by the dummy variable. Note that this is a simple parallel shift and does not affect the impact of the other independent variable; X 1 .This variable is a continuous random variable and predicts different values of y at different values of X 1 holding constant of the condition of the dummy variable.
Notification Switch
Would you like to follow the 'Introductory statistics' conversation and receive update notifications?

|
|

|
|

|
|

|
|

|
|

|
|
|
|
|

|
|
|
|
|

|
![[link]](#fig-ch12_04_05m.jpg)