

| << Chapter < Page | Chapter >> Page > |
Linear regression for two variables is based on a linear equation with one independent variable. The equation has the form:
where
a and
b are constant numbers.
The variable x is the independent variable, and y is the dependent variable. Another way to think about this equation is a statement of cause and effect. The X variable is the cause and the Y variable is the hypothesized effect. Typically, you choose a value to substitute for the independent variable and then solve for the dependent variable.
The following examples are linear equations.
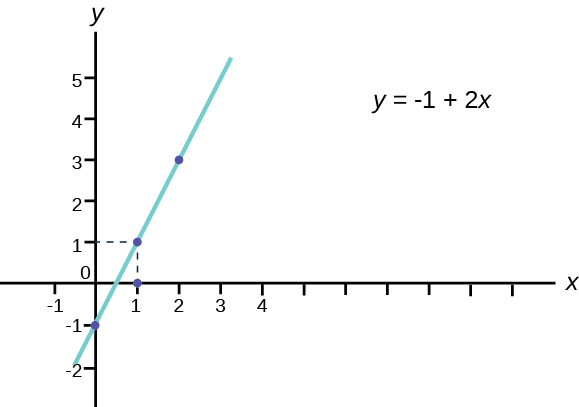
The graph of a linear equation of the form y = a + bx is a straight line . Any line that is not vertical can be described by this equation.
Graph the equation y = –1 + 2 x .
Is the following an example of a linear equation? Why or why not?
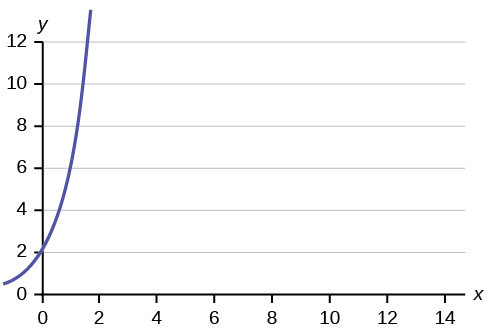
No, the graph is not a straight line; therefore, it is not a linear equation.
Aaron's Word Processing Service (AWPS) does word processing. The rate for services is $32 per hour plus a $31.50 one-time charge. The total cost to a customer depends on the number of hours it takes to complete the job.
Find the equation that expresses the total cost in terms of the number of hours required to complete the job.
Let
x = the number of hours it takes to get the job done.
Let
y = the total cost to the customer.
The $31.50 is a fixed cost. If it takes x hours to complete the job, then (32)( x ) is the cost of the word processing only. The total cost is: y = 31.50 + 32 x
For the linear equation y = a + bx , b = slope and a = y -intercept. From algebra recall that the slope is a number that describes the steepness of a line, and the y -intercept is the y coordinate of the point (0, a ) where the line crosses the y -axis.
Svetlana tutors to make extra money for college. For each tutoring session, she charges a one-time fee of $25 plus $15 per hour of tutoring. A linear equation that expresses the total amount of money Svetlana earns for each session she tutors is y = 25 + 15 x .
What are the independent and dependent variables? What is the y -intercept and what is the slope? Interpret them using complete sentences.
The independent variable ( x ) is the number of hours Svetlana tutors each session. The dependent variable ( y ) is the amount, in dollars, Svetlana earns for each session.
The y -intercept is 25 ( a = 25). At the start of the tutoring session, Svetlana charges a one-time fee of $25 (this is when x = 0). The slope is 15 ( b = 15). For each session, Svetlana earns $15 for each hour she tutors.
The most basic type of association is a linear association. This type of relationship can be defined algebraically by the equations used, numerically with actual or predicted data values, or graphically from a plotted curve. (Lines are classified as straight curves.) Algebraically, a linear equation typically takes the form y = mx + b , where m and b are constants, x is the independent variable, y is the dependent variable. In a statistical context, a linear equation is written in the form y = a + bx , where a and b are the constants. This form is used to help readers distinguish the statistical context from the algebraic context. In the equation y = a + bx , the constant b that multiplies the x variable ( b is called a coefficient) is called as the slope . The slope describes the rate of change between the independent and dependent variables; in other words, the rate of change describes the change that occurs in the dependent variable as the independent variable is changed. In the equation y = a + bx , the constant a is called as the y -intercept. Graphically, the y -intercept is the y coordinate of the point where the graph of the line crosses the y axis. At this point x = 0.
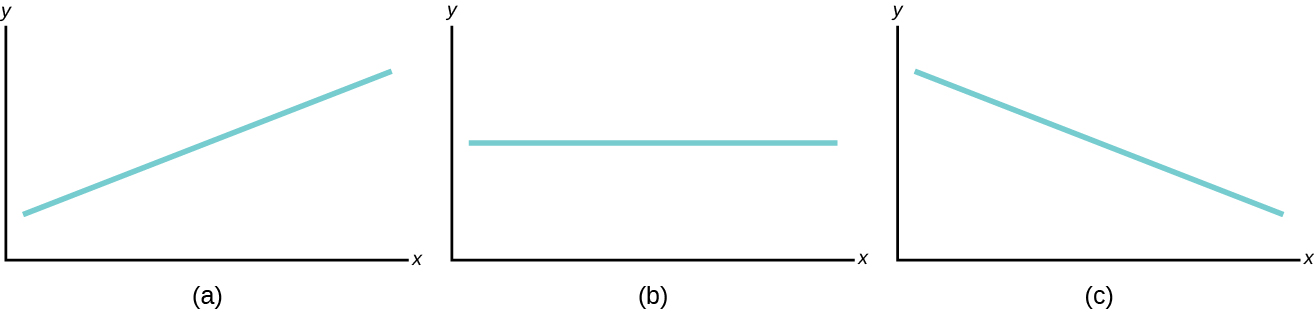
The slope of a line is a value that describes the rate of change between the independent and dependent variables. The slope tells us how the dependent variable ( y ) changes for every one unit increase in the independent ( x ) variable, on average. The y -intercept is used to describe the dependent variable when the independent variable equals zero. Graphically, the slope is represented by three line types in elementary statistics.
Notification Switch
Would you like to follow the 'Introductory statistics' conversation and receive update notifications?

|
|

|
|

|
|

|
|

|
|

|
|

|
|

|
|

|
|

|