<< Chapter < Page Chapter >> Page >

Access the following online resource for additional instruction and practice with graphs of parametric equations.

Key concepts

  • When there is a third variable, a third parameter on which x and y depend, parametric equations can be used.
  • To graph parametric equations by plotting points, make a table with three columns labeled t , x ( t ) , and y ( t ) . Choose values for t in increasing order. Plot the last two columns for x and y . See [link] and [link] .
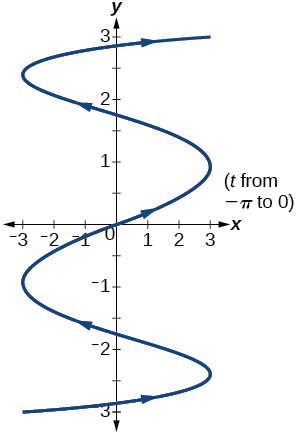
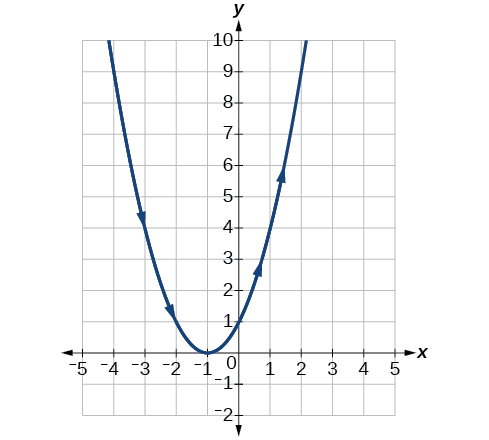
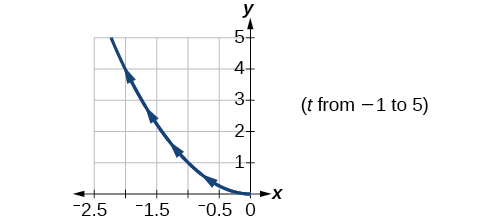
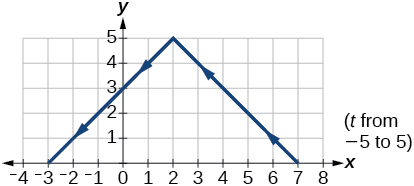
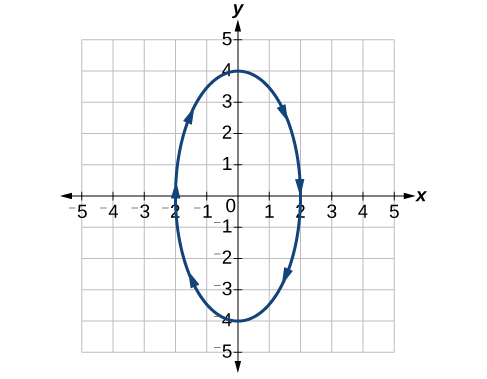
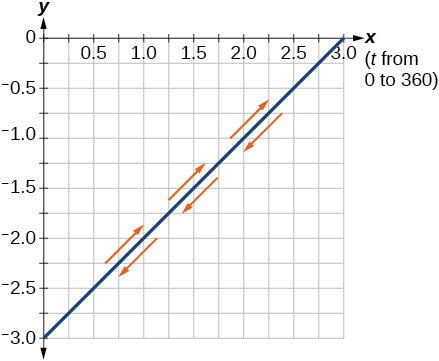
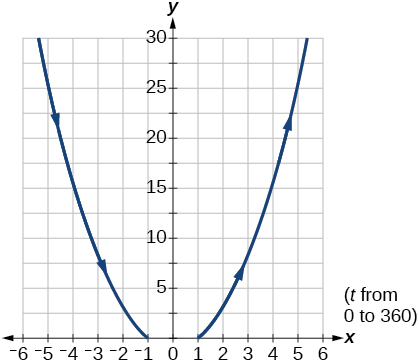
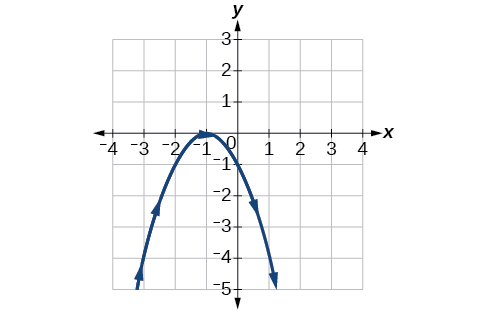
  • When graphing a parametric curve by plotting points, note the associated t -values and show arrows on the graph indicating the orientation of the curve. See [link] and [link] .
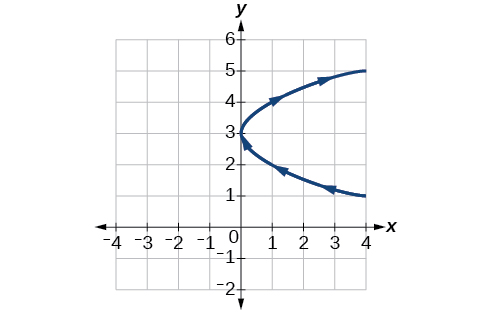
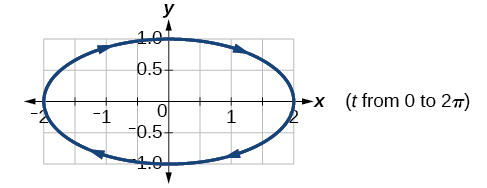
  • Parametric equations allow the direction or the orientation of the curve to be shown on the graph. Equations that are not functions can be graphed and used in many applications involving motion. See [link] .
  • Projectile motion depends on two parametric equations: x = ( v 0 cos θ ) t and y = 16 t 2 + ( v 0 sin θ ) t + h . Initial velocity is symbolized as v 0 . θ represents the initial angle of the object when thrown, and h represents the height at which the object is propelled.

Section exercises

Verbal

What are two methods used to graph parametric equations?

plotting points with the orientation arrow and a graphing calculator

Got questions? Get instant answers now!

What is one difference in point-plotting parametric equations compared to Cartesian equations?

Got questions? Get instant answers now!

Why are some graphs drawn with arrows?

The arrows show the orientation, the direction of motion according to increasing values of t .

Got questions? Get instant answers now!

Name a few common types of graphs of parametric equations.

Got questions? Get instant answers now!

Why are parametric graphs important in understanding projectile motion?

The parametric equations show the different vertical and horizontal motions over time.

Got questions? Get instant answers now!

Graphical

For the following exercises, graph each set of parametric equations by making a table of values. Include the orientation on the graph.

{ x ( t ) = t y ( t ) = t 2 1

t x y
3
2
1
0
1
2
3
Got questions? Get instant answers now!

{ x ( t ) = t 1 y ( t ) = t 2

t 3 2 1 0 1 2
x
y
Graph of the given equations - looks like an upward opening parabola.
Got questions? Get instant answers now!

{ x ( t ) = 2 + t y ( t ) = 3 2 t

t 2 1 0 1 2 3
x
y
Got questions? Get instant answers now!

{ x ( t ) = 2 2 t y ( t ) = 3 + t

t 3 2 1 0 1
x
y
Graph of the given equations - a line, negative slope.
Got questions? Get instant answers now!

{ x ( t ) = t 3 y ( t ) = t + 2

t 2 1 0 1 2
x
y
Got questions? Get instant answers now!

{ x ( t ) = t 2 y ( t ) = t + 3

t 2 1 0 1 2
x
y
Graph of the given equations - looks like a sideways parabola, opening to the right.
Got questions? Get instant answers now!

For the following exercises, sketch the curve and include the orientation.

{ x ( t ) = t y ( t ) = t

Got questions? Get instant answers now!

{ x ( t ) = t y ( t ) = t

Graph of the given equations - looks like the left half of an upward opening parabola.
Got questions? Get instant answers now!

{ x ( t ) = 5 | t | y ( t ) = t + 2

Got questions? Get instant answers now!

{ x ( t ) = t + 2 y ( t ) = 5 | t |

Graph of the given equations - looks like a downward opening absolute value function.
Got questions? Get instant answers now!

{ x ( t ) = 4 sin t y ( t ) = 2 cos t

Got questions? Get instant answers now!

{ x ( t ) = 2 sin t y ( t ) = 4 cos t

Graph of the given equations - a vertical ellipse.
Got questions? Get instant answers now!

{ x ( t ) = 3 cos 2 t y ( t ) = −3 sin t

Got questions? Get instant answers now!

{ x ( t ) = 3 cos 2 t y ( t ) = −3 sin 2 t

Graph of the given equations- line from (0, -3) to (3,0). It is traversed in both directions, positive and negative slope.
Got questions? Get instant answers now!

{ x ( t ) = sec t y ( t ) = tan t

Got questions? Get instant answers now!

{ x ( t ) = sec t y ( t ) = tan 2 t

Graph of the given equations- looks like an upward opening parabola.
Got questions? Get instant answers now!

{ x ( t ) = 1 e 2 t y ( t ) = e t

Got questions? Get instant answers now!

For the following exercises, graph the equation and include the orientation. Then, write the Cartesian equation.

{ x ( t ) = t 1 y ( t ) = t 2

Graph of the given equations- looks like a downward opening parabola.
Got questions? Get instant answers now!

{ x ( t ) = t 3 y ( t ) = t + 3

Got questions? Get instant answers now!

{ x ( t ) = 2 cos t y ( t ) = sin t

Graph of the given equations- horizontal ellipse.

Got questions? Get instant answers now!

{ x ( t ) = 7 cos t y ( t ) = 7 sin t

Got questions? Get instant answers now!

{ x ( t ) = e 2 t y ( t ) = e t

Graph of the given equations- looks like the lower half of a sideways parabola opening to the right
Got questions? Get instant answers now!

For the following exercises, graph the equation and include the orientation.

x = t 2 , y = 3 t , 0 t 5

Got questions? Get instant answers now!

x = 2 t , y = t 2 , 5 t 5

Graph of the given equations- looks like an upwards opening parabola
Got questions? Get instant answers now!

x = t , y = 25 t 2 , 0 < t 5

Got questions? Get instant answers now!

x ( t ) = t , y ( t ) = t , t 0

Graph of the given equations- looks like the upper half of a sideways parabola opening to the left
Got questions? Get instant answers now!

x = 2 cos t , y = 6 sin t , 0 t π

Got questions? Get instant answers now!

x = sec t , y = tan t , π 2 < t < π 2

Graph of the given equations- the left half of a hyperbola with diagonal asymptotes
Got questions? Get instant answers now!

For the following exercises, use the parametric equations for integers a and b :

x ( t ) = a cos ( ( a + b ) t ) y ( t ) = a cos ( ( a b ) t )

Graph on the domain [ π , 0 ] , where a = 2 and b = 1 , and include the orientation.

Got questions? Get instant answers now!

Graph on the domain [ π , 0 ] , where a = 3 and b = 2 , and include the orientation.

Graph of the given equations - vertical periodic trajectory
Got questions? Get instant answers now!

Graph on the domain [ π , 0 ] , where a = 4 and b = 3 , and include the orientation.

Got questions? Get instant answers now!

Questions & Answers

Ayele, K., 2003. Introductory Economics, 3rd ed., Addis Ababa.
Widad Reply
can you send the book attached ?
Ariel
?
Ariel
What is economics
Widad Reply
the study of how humans make choices under conditions of scarcity
AI-Robot
U(x,y) = (x×y)1/2 find mu of x for y
Desalegn Reply
U(x,y) = (x×y)1/2 find mu of x for y
Desalegn
what is ecnomics
Jan Reply
this is the study of how the society manages it's scarce resources
Belonwu
what is macroeconomic
John Reply
macroeconomic is the branch of economics which studies actions, scale, activities and behaviour of the aggregate economy as a whole.
husaini
etc
husaini
difference between firm and industry
husaini Reply
what's the difference between a firm and an industry
Abdul
firm is the unit which transform inputs to output where as industry contain combination of firms with similar production 😅😅
Abdulraufu
Suppose the demand function that a firm faces shifted from Qd  120 3P to Qd  90  3P and the supply function has shifted from QS  20  2P to QS 10  2P . a) Find the effect of this change on price and quantity. b) Which of the changes in demand and supply is higher?
Toofiq Reply
explain standard reason why economic is a science
innocent Reply
factors influencing supply
Petrus Reply
what is economic.
Milan Reply
scares means__________________ends resources. unlimited
Jan
economics is a science that studies human behaviour as a relationship b/w ends and scares means which have alternative uses
Jan
calculate the profit maximizing for demand and supply
Zarshad Reply
Why qualify 28 supplies
Milan
what are explicit costs
Nomsa Reply
out-of-pocket costs for a firm, for example, payments for wages and salaries, rent, or materials
AI-Robot
concepts of supply in microeconomics
David Reply
economic overview notes
Amahle Reply
identify a demand and a supply curve
Salome Reply
i don't know
Parul
there's a difference
Aryan
Demand curve shows that how supply and others conditions affect on demand of a particular thing and what percent demand increase whith increase of supply of goods
Israr
Hi Sir please how do u calculate Cross elastic demand and income elastic demand?
Abari
Got questions? Join the online conversation and get instant answers!
Jobilize.com Reply

Get Jobilize Job Search Mobile App in your pocket Now!

Get it on Google Play Download on the App Store Now


Source:  OpenStax, Algebra and trigonometry. OpenStax CNX. Nov 14, 2016 Download for free at https://legacy.cnx.org/content/col11758/1.6
Google Play and the Google Play logo are trademarks of Google Inc.

Notification Switch

Would you like to follow the 'Algebra and trigonometry' conversation and receive update notifications?

Ask