<< Chapter < Page Chapter >> Page >
Graph of f(x)=1/x with its vertical asymptote at x=0.

Vertical asymptote

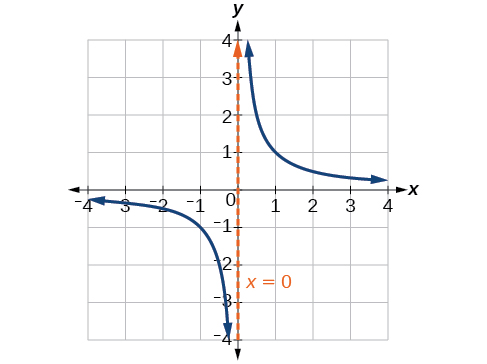
A vertical asymptote    of a graph is a vertical line x = a where the graph tends toward positive or negative infinity as the inputs approach a . We write

As  x a , f ( x ) ,   or as  x a , f ( x ) .

End behavior of f ( x ) = 1 x

As the values of x approach infinity, the function values approach 0. As the values of x approach negative infinity, the function values approach 0. See [link] . Symbolically, using arrow notation

As  x , f ( x ) 0 , and as  x , f ( x ) 0.

Graph of f(x)=1/x which highlights the segments of the turning points to denote their end behavior.

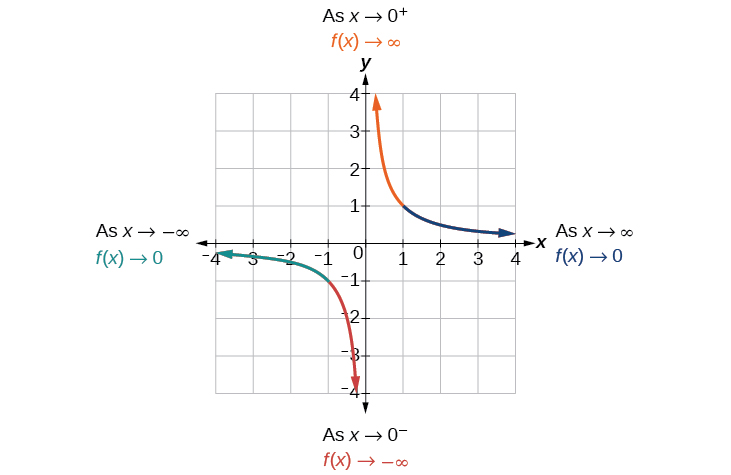
Based on this overall behavior and the graph, we can see that the function approaches 0 but never actually reaches 0; it seems to level off as the inputs become large. This behavior creates a horizontal asymptote , a horizontal line that the graph approaches as the input increases or decreases without bound. In this case, the graph is approaching the horizontal line y = 0. See [link] .

Graph of f(x)=1/x with its vertical asymptote at x=0 and its horizontal asymptote at y=0.

Horizontal asymptote

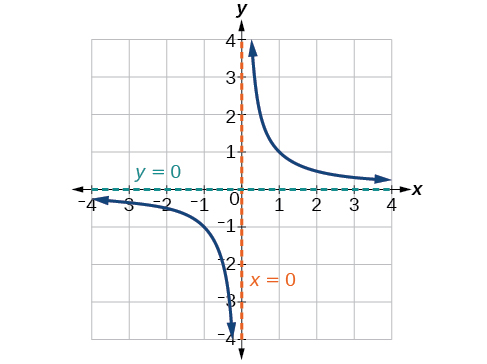
A horizontal asymptote    of a graph is a horizontal line y = b where the graph approaches the line as the inputs increase or decrease without bound. We write

As  x  or  x ,   f ( x ) b .

Using arrow notation

Use arrow notation to describe the end behavior and local behavior of the function graphed in [link] .

Graph of f(x)=1/(x-2)+4 with its vertical asymptote at x=2 and its horizontal asymptote at y=4.

Notice that the graph is showing a vertical asymptote at x = 2 , which tells us that the function is undefined at x = 2.

As  x 2 , f ( x ) ,  and as  x 2 + ,   f ( x ) .

And as the inputs decrease without bound, the graph appears to be leveling off at output values of 4, indicating a horizontal asymptote at y = 4. As the inputs increase without bound, the graph levels off at 4.

As  x ,   f ( x ) 4  and as  x ,   f ( x ) 4.
Got questions? Get instant answers now!

Use arrow notation to describe the end behavior and local behavior for the reciprocal squared function.

End behavior: as x ± ,   f ( x ) 0 ; Local behavior: as x 0 ,   f ( x ) (there are no x - or y -intercepts)

Got questions? Get instant answers now!

Using transformations to graph a rational function

Sketch a graph of the reciprocal function shifted two units to the left and up three units. Identify the horizontal and vertical asymptotes of the graph, if any.

Shifting the graph left 2 and up 3 would result in the function

f ( x ) = 1 x + 2 + 3

or equivalently, by giving the terms a common denominator,

f ( x ) = 3 x + 7 x + 2

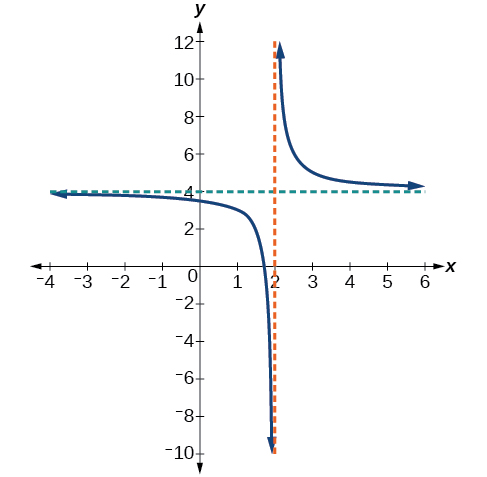
The graph of the shifted function is displayed in [link] .

Graph of f(x)=1/(x+2)+3 with its vertical asymptote at x=-2 and its horizontal asymptote at y=3.

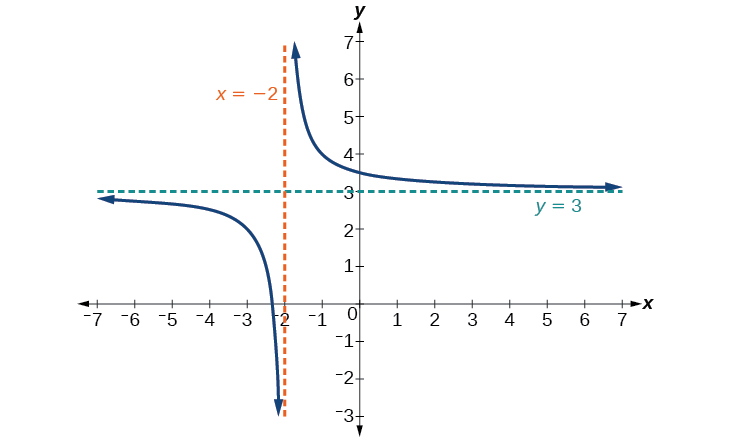
Notice that this function is undefined at x = −2 , and the graph also is showing a vertical asymptote at x = −2.

As  x 2 ,   f ( x ) , and as   x 2 + ,   f ( x ) .

As the inputs increase and decrease without bound, the graph appears to be leveling off at output values of 3, indicating a horizontal asymptote at y = 3.

As  x ± ,   f ( x ) 3.
Got questions? Get instant answers now!

Sketch the graph, and find the horizontal and vertical asymptotes of the reciprocal squared function that has been shifted right 3 units and down 4 units.

Graph of f(x)=1/(x-3)^2-4 with its vertical asymptote at x=3 and its horizontal asymptote at y=-4.

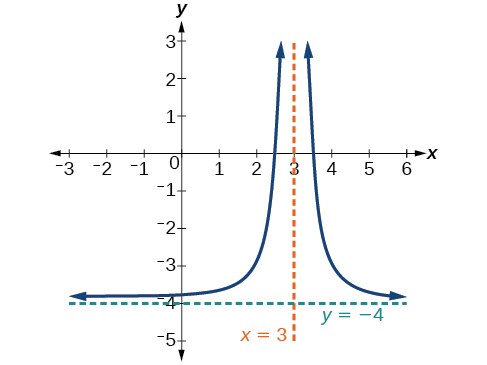
The function and the asymptotes are shifted 3 units right and 4 units down. As x 3 , f ( x ) , and as x ± , f ( x ) 4.

The function is f ( x ) = 1 ( x 3 ) 2 4.

Got questions? Get instant answers now!

Solving applied problems involving rational functions

In [link] , we shifted a toolkit function in a way that resulted in the function f ( x ) = 3 x + 7 x + 2 . This is an example of a rational function. A rational function is a function that can be written as the quotient of two polynomial functions. Many real-world problems require us to find the ratio of two polynomial functions. Problems involving rates and concentrations often involve rational functions.

Questions & Answers

Ayele, K., 2003. Introductory Economics, 3rd ed., Addis Ababa.
Widad Reply
can you send the book attached ?
Ariel
?
Ariel
What is economics
Widad Reply
the study of how humans make choices under conditions of scarcity
AI-Robot
U(x,y) = (x×y)1/2 find mu of x for y
Desalegn Reply
U(x,y) = (x×y)1/2 find mu of x for y
Desalegn
what is ecnomics
Jan Reply
this is the study of how the society manages it's scarce resources
Belonwu
what is macroeconomic
John Reply
macroeconomic is the branch of economics which studies actions, scale, activities and behaviour of the aggregate economy as a whole.
husaini
etc
husaini
difference between firm and industry
husaini Reply
what's the difference between a firm and an industry
Abdul
firm is the unit which transform inputs to output where as industry contain combination of firms with similar production 😅😅
Abdulraufu
Suppose the demand function that a firm faces shifted from Qd  120 3P to Qd  90  3P and the supply function has shifted from QS  20  2P to QS 10  2P . a) Find the effect of this change on price and quantity. b) Which of the changes in demand and supply is higher?
Toofiq Reply
explain standard reason why economic is a science
innocent Reply
factors influencing supply
Petrus Reply
what is economic.
Milan Reply
scares means__________________ends resources. unlimited
Jan
economics is a science that studies human behaviour as a relationship b/w ends and scares means which have alternative uses
Jan
calculate the profit maximizing for demand and supply
Zarshad Reply
Why qualify 28 supplies
Milan
what are explicit costs
Nomsa Reply
out-of-pocket costs for a firm, for example, payments for wages and salaries, rent, or materials
AI-Robot
concepts of supply in microeconomics
David Reply
economic overview notes
Amahle Reply
identify a demand and a supply curve
Salome Reply
i don't know
Parul
there's a difference
Aryan
Demand curve shows that how supply and others conditions affect on demand of a particular thing and what percent demand increase whith increase of supply of goods
Israr
Hi Sir please how do u calculate Cross elastic demand and income elastic demand?
Abari
Got questions? Join the online conversation and get instant answers!
Jobilize.com Reply
Practice Key Terms 5

Get Jobilize Job Search Mobile App in your pocket Now!

Get it on Google Play Download on the App Store Now


Source:  OpenStax, Algebra and trigonometry. OpenStax CNX. Nov 14, 2016 Download for free at https://legacy.cnx.org/content/col11758/1.6
Google Play and the Google Play logo are trademarks of Google Inc.

Notification Switch

Would you like to follow the 'Algebra and trigonometry' conversation and receive update notifications?

Ask