

| << Chapter < Page | Chapter >> Page > |
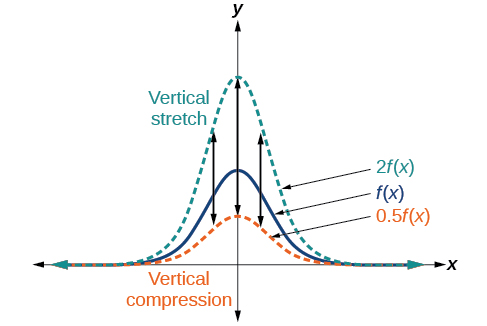
Given a function a new function where is a constant, is a vertical stretch or vertical compression of the function
Given a function, graph its vertical stretch.
If the graph is stretched by a factor of
If the graph is compressed by a factor of
If the graph is either stretched or compressed and also reflected about the x -axis.
A function models the population of fruit flies. The graph is shown in [link] .
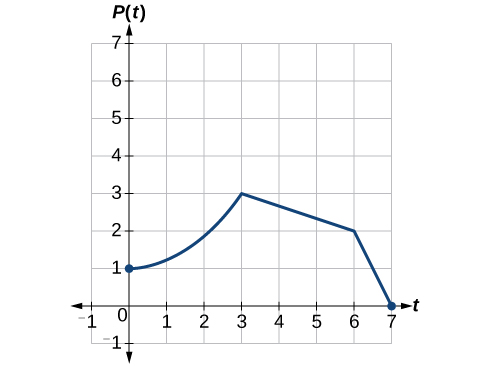
A scientist is comparing this population to another population, whose growth follows the same pattern, but is twice as large. Sketch a graph of this population.
Because the population is always twice as large, the new population’s output values are always twice the original function’s output values. Graphically, this is shown in [link] .
If we choose four reference points, (0, 1), (3, 3), (6, 2) and (7, 0) we will multiply all of the outputs by 2.
The following shows where the new points for the new graph will be located.
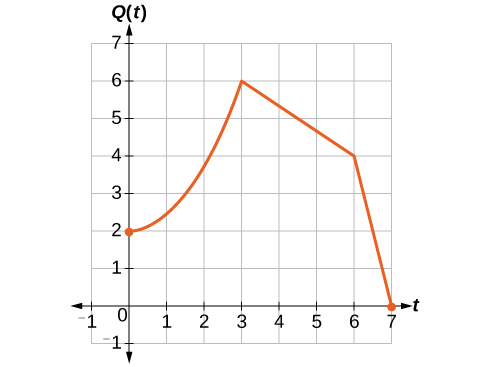
Symbolically, the relationship is written as
This means that for any input the value of the function is twice the value of the function Notice that the effect on the graph is a vertical stretching of the graph, where every point doubles its distance from the horizontal axis. The input values, stay the same while the output values are twice as large as before.
Given a tabular function and assuming that the transformation is a vertical stretch or compression, create a table for a vertical compression.
A function is given as [link] . Create a table for the function
| 2 | 4 | 6 | 8 | |
| 1 | 3 | 7 | 11 |
The formula tells us that the output values of are half of the output values of with the same inputs. For example, we know that Then
We do the same for the other values to produce [link] .
A function is given as [link] . Create a table for the function
| 2 | 4 | 6 | 8 | |
| 12 | 16 | 20 | 0 |
| 2 | 4 | 6 | 8 | |
| 9 | 12 | 15 | 0 |
The graph in [link] is a transformation of the toolkit function Relate this new function to and then find a formula for
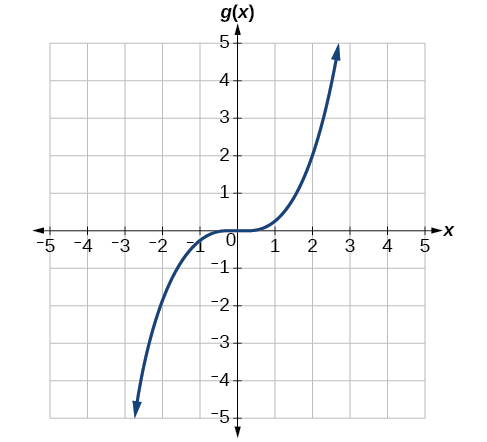
When trying to determine a vertical stretch or shift, it is helpful to look for a point on the graph that is relatively clear. In this graph, it appears that With the basic cubic function at the same input, Based on that, it appears that the outputs of are the outputs of the function because From this we can fairly safely conclude that
We can write a formula for by using the definition of the function
Notification Switch
Would you like to follow the 'Algebra and trigonometry' conversation and receive update notifications?

|
|
|
|
|

|
|

|
|

|
|

|
|

|
|

|
|

|
|

|
|
|
|
|

|