<< Chapter < Page
  Introductory statistics     Page 34 / 36
Chapter >> Page >

14 . c. Iris

15 . c. Student's t

16 . b. is left-tailed.

17 . c. cluster sampling

18 . b. median

19 . a. the probability that an outcome of the data will happen purely by chance when the null hypothesis is true.

20 . d. stratified

21 . b. 25

22 . c. 4

23 . a. (1.85, 2.32)

24 . c. Both above are correct.

25 . c. 5.8

26 . c. 0.6321

27 . a. 0.8413

28 . a. (0.6030, 0.7954)

29 . a. N 145 14 10

30 . d. 3.66

31 . b. 5.1

32 . a. 13.46

33 . b. There is a strong linear pattern. Therefore, it is most likely a good model to be used.

34 . b. Chi 2 3 .

35 . d. 70

36 . b. There is sufficient evidence to conclude that the choice of major and the gender of the student are not independent of each other.

37 . a. Chi 2 goodness-of-fit

Practice final exam 2

1 . A study was done to determine the proportion of teenagers that own a car. The population proportion of teenagers that own a car is the:

  1. statistic.
  2. parameter.
  3. population.
  4. variable.


Use the following information to answer the next two exercises:

value frequency
0 1
1 4
2 7
3 9
6 4

2 . The box plot for the data is:

This shows 4 boxplots, each over a number line scaled from 0 - 6. Boxplot (a) has left whisker from 0 to 2, box from 2 to 3, and right whisker from 3 to 6. Boxplot (b) has left whisker from 0 to 1, box from 1 to 4 with a dashed line at 3, and right whisker from 4 to 6. Boxplot (c) has box from 0 to 4 with a dashed line at 3 and right whisker from 4 to 6. Boxplot (d) has left whisker from 0 to 1, box from 1 to 3 with a dashed line at 2, and right whisker from 3 to 6.

3 . If six were added to each value of the data in the table, the 15 th percentile of the new list of values is:

  1. six
  2. one
  3. seven
  4. eight


Use the following information to answer the next two exercises: Suppose that the probability of a drought in any independent year is 20%. Out of those years in which a drought occurs, the probability of water rationing is ten percent. However, in any year, the probability of water rationing is five percent.

4 . What is the probability of both a drought and water rationing occurring?

  1. 0.05
  2. 0.01
  3. 0.02
  4. 0.30

5 . Which of the following is true?

  1. Drought and water rationing are independent events.
  2. Drought and water rationing are mutually exclusive events.
  3. None of the above


Use the following information to answer the next two exercises: Suppose that a survey yielded the following data:

Favorite pie
gender apple pumpkin pecan
female 40 10 30
male 20 30 10

6 . Suppose that one individual is randomly chosen. The probability that the person’s favorite pie is apple or the person is male is _____.

  1. 40 60
  2. 60 140
  3. 120 140
  4. 100 140

7 . Suppose H 0 is: Favorite pie and gender are independent. The p -value is ______.

  1. ≈ 0
  2. 1
  3. 0.05
  4. cannot be determined


Use the following information to answer the next two exercises: Let’s say that the probability that an adult watches the news at least once per week is 0.60. We randomly survey 14 people. Of interest is the number of people who watch the news at least once per week.

8 . Which of the following statements is FALSE?

  1. X ~ B (14 0.60)
  2. The values for x are: {1 ,2 ,3 ,... ,14}.
  3. μ = 8.4
  4. P ( X = 5) = 0.0408

9 . Find the probability that at least six adults watch the news at least once per week.

  1. 6 14
  2. 0.8499
  3. 0.9417
  4. 0.6429

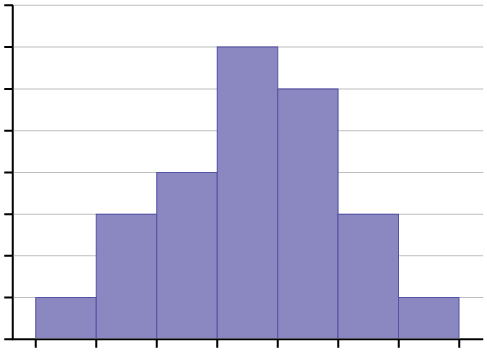
10 . The following histogram is most likely to be a result of sampling from which distribution?

This graph is an unlabeled histogram. The distribution is roughly symmetric. There is a single peak in the center of the graph and heights of bars decrease from that point toward each end of the graph.
  1. chi-square with df = 6
  2. exponential
  3. uniform
  4. binomial

11 . The ages of campus day and evening students is known to be normally distributed. A sample of six campus day and evening students reported their ages (in years) as: {18, 35, 27, 45, 20, 20}. What is the error bound for the 90% confidence interval of the true average age?

  1. 11.2
  2. 22.3
  3. 17.5
  4. 8.7

Questions & Answers

What are the factors that affect demand for a commodity
Florence Reply
differentiate between demand and supply giving examples
Lambiv Reply
differentiated between demand and supply using examples
Lambiv
what is labour ?
Lambiv
how will I do?
Venny Reply
how is the graph works?I don't fully understand
Rezat Reply
information
Eliyee
devaluation
Eliyee
t
WARKISA
hi guys good evening to all
Lambiv
multiple choice question
Aster Reply
appreciation
Eliyee
explain perfect market
Lindiwe Reply
In economics, a perfect market refers to a theoretical construct where all participants have perfect information, goods are homogenous, there are no barriers to entry or exit, and prices are determined solely by supply and demand. It's an idealized model used for analysis,
Ezea
What is ceteris paribus?
Shukri Reply
other things being equal
AI-Robot
When MP₁ becomes negative, TP start to decline. Extuples Suppose that the short-run production function of certain cut-flower firm is given by: Q=4KL-0.6K2 - 0.112 • Where is quantity of cut flower produced, I is labour input and K is fixed capital input (K-5). Determine the average product of lab
Kelo
Extuples Suppose that the short-run production function of certain cut-flower firm is given by: Q=4KL-0.6K2 - 0.112 • Where is quantity of cut flower produced, I is labour input and K is fixed capital input (K-5). Determine the average product of labour (APL) and marginal product of labour (MPL)
Kelo
yes,thank you
Shukri
Can I ask you other question?
Shukri
what is monopoly mean?
Habtamu Reply
What is different between quantity demand and demand?
Shukri Reply
Quantity demanded refers to the specific amount of a good or service that consumers are willing and able to purchase at a give price and within a specific time period. Demand, on the other hand, is a broader concept that encompasses the entire relationship between price and quantity demanded
Ezea
ok
Shukri
how do you save a country economic situation when it's falling apart
Lilia Reply
what is the difference between economic growth and development
Fiker Reply
Economic growth as an increase in the production and consumption of goods and services within an economy.but Economic development as a broader concept that encompasses not only economic growth but also social & human well being.
Shukri
production function means
Jabir
What do you think is more important to focus on when considering inequality ?
Abdisa Reply
any question about economics?
Awais Reply
sir...I just want to ask one question... Define the term contract curve? if you are free please help me to find this answer 🙏
Asui
it is a curve that we get after connecting the pareto optimal combinations of two consumers after their mutually beneficial trade offs
Awais
thank you so much 👍 sir
Asui
In economics, the contract curve refers to the set of points in an Edgeworth box diagram where both parties involved in a trade cannot be made better off without making one of them worse off. It represents the Pareto efficient allocations of goods between two individuals or entities, where neither p
Cornelius
In economics, the contract curve refers to the set of points in an Edgeworth box diagram where both parties involved in a trade cannot be made better off without making one of them worse off. It represents the Pareto efficient allocations of goods between two individuals or entities,
Cornelius
Suppose a consumer consuming two commodities X and Y has The following utility function u=X0.4 Y0.6. If the price of the X and Y are 2 and 3 respectively and income Constraint is birr 50. A,Calculate quantities of x and y which maximize utility. B,Calculate value of Lagrange multiplier. C,Calculate quantities of X and Y consumed with a given price. D,alculate optimum level of output .
Feyisa Reply
Answer
Feyisa
c
Jabir
the market for lemon has 10 potential consumers, each having an individual demand curve p=101-10Qi, where p is price in dollar's per cup and Qi is the number of cups demanded per week by the i th consumer.Find the market demand curve using algebra. Draw an individual demand curve and the market dema
Gsbwnw Reply
suppose the production function is given by ( L, K)=L¼K¾.assuming capital is fixed find APL and MPL. consider the following short run production function:Q=6L²-0.4L³ a) find the value of L that maximizes output b)find the value of L that maximizes marginal product
Abdureman
Got questions? Join the online conversation and get instant answers!
Jobilize.com Reply

Get Jobilize Job Search Mobile App in your pocket Now!

Get it on Google Play Download on the App Store Now


Source:  OpenStax, Introductory statistics. OpenStax CNX. May 06, 2016 Download for free at http://legacy.cnx.org/content/col11562/1.18
Google Play and the Google Play logo are trademarks of Google Inc.

Notification Switch

Would you like to follow the 'Introductory statistics' conversation and receive update notifications?

Ask