<< Chapter < Page
  Introductory statistics     Page 35 / 36
Chapter >> Page >

12 . If a normally distributed random variable has µ = 0 and σ = 1, then 97.5% of the population values lie above:

  1. –1.96.
  2. 1.96.
  3. 1.
  4. –1.


Use the following information to answer the next three exercises. The amount of money a customer spends in one trip to the supermarket is known to have an exponential distribution. Suppose the average amount of money a customer spends in one trip to the supermarket is $72.

13 . What is the probability that one customer spends less than $72 in one trip to the supermarket?

  1. 0.6321
  2. 0.5000
  3. 0.3714
  4. 1

14 . How much money altogether would you expect the next five customers to spend in one trip to the supermarket (in dollars)?

  1. 72
  2. 72 2 5
  3. 5184
  4. 360

15 . If you want to find the probability that the mean amount of money 50 customers spend in one trip to the supermarket is less than $60, the distribution to use is:

  1. N (72, 72)
  2. N ( 72 , 72 50 )
  3. Exp (72)
  4. E x p ( 1 72 )


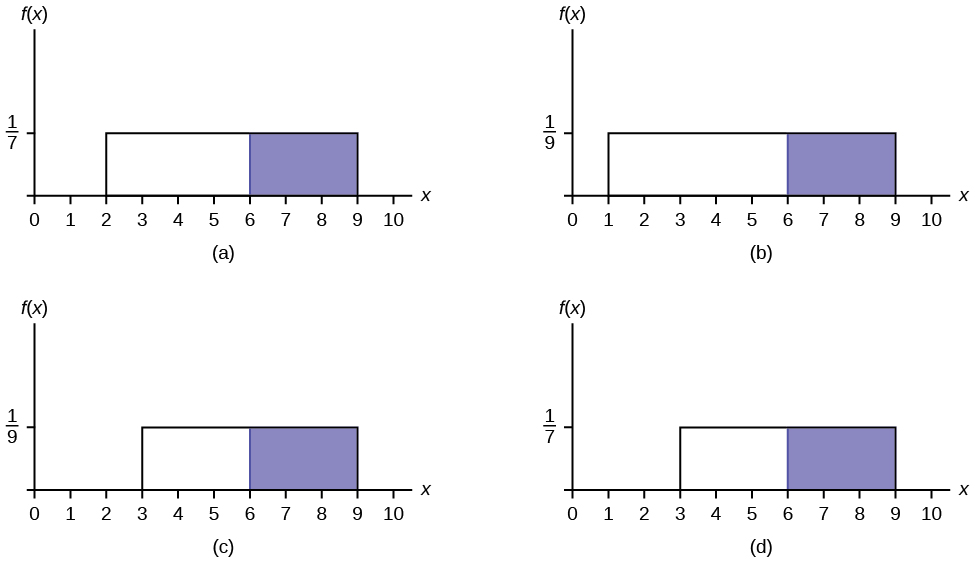
Use the following information to answer the next three exercises: The amount of time it takes a fourth grader to carry out the trash is uniformly distributed in the interval from one to ten minutes.

16 . What is the probability that a randomly chosen fourth grader takes more than seven minutes to take out the trash?

  1. 3 9
  2. 7 9
  3. 3 10
  4. 7 10

17 . Which graph best shows the probability that a randomly chosen fourth grader takes more than six minutes to take out the trash given that he or she has already taken more than three minutes?

There are 4 uniform distribution graphs. Graph (a) shows a Uniform Distribution from x = 2 to x =  9 with a height of 1/7. The area between x = 6 and x = 9 is shaded. Graph (b) shows a Uniform Distribution from x = 1 to x =  9 with a height of 1/9. The area between x = 6 and x = 9 is shaded. Graph (c) shows a Uniform Distribution from x = 3 to x =  9 with a height of 1/9. The area between x = 6 and x = 9 is shaded. Graph (d) shows a Uniform Distribution from x = 3 to x =  9 with a height of 1/7. The area between x = 6 and x = 9 is shaded.

18 . We should expect a fourth grader to take how many minutes to take out the trash?

  1. 4.5
  2. 5.5
  3. 5
  4. 10


Use the following information to answer the next three exercises: At the beginning of the quarter, the amount of time a student waits in line at the campus cafeteria is normally distributed with a mean of five minutes and a standard deviation of 1.5 minutes.

19 . What is the 90 th percentile of waiting times (in minutes)?

  1. 1.28
  2. 90
  3. 7.47
  4. 6.92

20 . The median waiting time (in minutes) for one student is:

  1. 5.
  2. 50.
  3. 2.5.
  4. 1.5.

21 . Find the probability that the average wait time for ten students is at most 5.5 minutes.

  1. 0.6301
  2. 0.8541
  3. 0.3694
  4. 0.1459

22 . A sample of 80 software engineers in Silicon Valley is taken and it is found that 20% of them earn approximately $50,000 per year. A point estimate for the true proportion of engineers in Silicon Valley who earn $50,000 per year is:

  1. 16.
  2. 0.2.
  3. 1.
  4. 0.95.

23 . If P ( Z < z α ) = 0.1587 where Z ~ N (0, 1), then α is equal to:

  1. –1.
  2. 0.1587.
  3. 0.8413.
  4. 1.

24 . A professor tested 35 students to determine their entering skills. At the end of the term, after completing the course, the same test was administered to the same 35 students to study their improvement. This would be a test of:

  1. independent groups.
  2. two proportions.
  3. matched pairs, dependent groups.
  4. exclusive groups.

A math exam was given to all the third grade children attending ABC School. Two random samples of scores were taken.

n x ¯ s
Boys 55 82 5
Girls 60 86 7

25 . Which of the following correctly describes the results of a hypothesis test of the claim, “There is a difference between the mean scores obtained by third grade girls and boys at the 5% level of significance”?

  1. Do not reject H 0 . There is insufficient evidence to conclude that there is a difference in the mean scores.
  2. Do not reject H 0 . There is sufficient evidence to conclude that there is a difference in the mean scores.
  3. Reject H 0 . There is insufficient evidence to conclude that there is no difference in the mean scores.
  4. Reject H 0 . There is sufficient evidence to conclude that there is a difference in the mean scores.

Questions & Answers

differentiate between demand and supply giving examples
Lambiv Reply
differentiated between demand and supply using examples
Lambiv
what is labour ?
Lambiv
how will I do?
Venny Reply
how is the graph works?I don't fully understand
Rezat Reply
information
Eliyee
devaluation
Eliyee
t
WARKISA
hi guys good evening to all
Lambiv
multiple choice question
Aster Reply
appreciation
Eliyee
explain perfect market
Lindiwe Reply
In economics, a perfect market refers to a theoretical construct where all participants have perfect information, goods are homogenous, there are no barriers to entry or exit, and prices are determined solely by supply and demand. It's an idealized model used for analysis,
Ezea
What is ceteris paribus?
Shukri Reply
other things being equal
AI-Robot
When MP₁ becomes negative, TP start to decline. Extuples Suppose that the short-run production function of certain cut-flower firm is given by: Q=4KL-0.6K2 - 0.112 • Where is quantity of cut flower produced, I is labour input and K is fixed capital input (K-5). Determine the average product of lab
Kelo
Extuples Suppose that the short-run production function of certain cut-flower firm is given by: Q=4KL-0.6K2 - 0.112 • Where is quantity of cut flower produced, I is labour input and K is fixed capital input (K-5). Determine the average product of labour (APL) and marginal product of labour (MPL)
Kelo
yes,thank you
Shukri
Can I ask you other question?
Shukri
what is monopoly mean?
Habtamu Reply
What is different between quantity demand and demand?
Shukri Reply
Quantity demanded refers to the specific amount of a good or service that consumers are willing and able to purchase at a give price and within a specific time period. Demand, on the other hand, is a broader concept that encompasses the entire relationship between price and quantity demanded
Ezea
ok
Shukri
how do you save a country economic situation when it's falling apart
Lilia Reply
what is the difference between economic growth and development
Fiker Reply
Economic growth as an increase in the production and consumption of goods and services within an economy.but Economic development as a broader concept that encompasses not only economic growth but also social & human well being.
Shukri
production function means
Jabir
What do you think is more important to focus on when considering inequality ?
Abdisa Reply
any question about economics?
Awais Reply
sir...I just want to ask one question... Define the term contract curve? if you are free please help me to find this answer 🙏
Asui
it is a curve that we get after connecting the pareto optimal combinations of two consumers after their mutually beneficial trade offs
Awais
thank you so much 👍 sir
Asui
In economics, the contract curve refers to the set of points in an Edgeworth box diagram where both parties involved in a trade cannot be made better off without making one of them worse off. It represents the Pareto efficient allocations of goods between two individuals or entities, where neither p
Cornelius
In economics, the contract curve refers to the set of points in an Edgeworth box diagram where both parties involved in a trade cannot be made better off without making one of them worse off. It represents the Pareto efficient allocations of goods between two individuals or entities,
Cornelius
Suppose a consumer consuming two commodities X and Y has The following utility function u=X0.4 Y0.6. If the price of the X and Y are 2 and 3 respectively and income Constraint is birr 50. A,Calculate quantities of x and y which maximize utility. B,Calculate value of Lagrange multiplier. C,Calculate quantities of X and Y consumed with a given price. D,alculate optimum level of output .
Feyisa Reply
Answer
Feyisa
c
Jabir
the market for lemon has 10 potential consumers, each having an individual demand curve p=101-10Qi, where p is price in dollar's per cup and Qi is the number of cups demanded per week by the i th consumer.Find the market demand curve using algebra. Draw an individual demand curve and the market dema
Gsbwnw Reply
suppose the production function is given by ( L, K)=L¼K¾.assuming capital is fixed find APL and MPL. consider the following short run production function:Q=6L²-0.4L³ a) find the value of L that maximizes output b)find the value of L that maximizes marginal product
Abdureman
types of unemployment
Yomi Reply
What is the difference between perfect competition and monopolistic competition?
Mohammed
Got questions? Join the online conversation and get instant answers!
Jobilize.com Reply

Get Jobilize Job Search Mobile App in your pocket Now!

Get it on Google Play Download on the App Store Now


Source:  OpenStax, Introductory statistics. OpenStax CNX. May 06, 2016 Download for free at http://legacy.cnx.org/content/col11562/1.18
Google Play and the Google Play logo are trademarks of Google Inc.

Notification Switch

Would you like to follow the 'Introductory statistics' conversation and receive update notifications?

Ask