<< Chapter < Page Chapter >> Page >

Good stress?

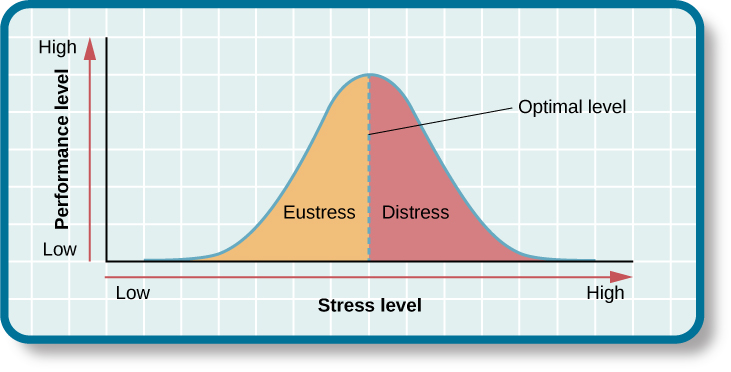
Although stress carries a negative connotation, at times it may be of some benefit. Stress can motivate us to do things in our best interests, such as study for exams, visit the doctor regularly, exercise, and perform to the best of our ability at work. Indeed, Selye (1974) pointed out that not all stress is harmful. He argued that stress can sometimes be a positive, motivating force that can improve the quality of our lives. This kind of stress, which Selye called eustress    (from the Greek eu = “good”), is a good kind of stress associated with positive feelings, optimal health, and performance. A moderate amount of stress can be beneficial in challenging situations. For example, athletes may be motivated and energized by pregame stress, and students may experience similar beneficial stress before a major exam. Indeed, research shows that moderate stress can enhance both immediate and delayed recall of educational material. Male participants in one study who memorized a scientific text passage showed improved memory of the passage immediately after exposure to a mild stressor as well as one day following exposure to the stressor (Hupbach&Fieman, 2012).

Increasing one’s level of stress will cause performance to change in a predictable way. As shown in [link] , as stress increases, so do performance and general well-being (eustress); when stress levels reach an optimal level (the highest point of the curve), performance reaches its peak. A person at this stress level is colloquially at the top of his game, meaning he feels fully energized, focused, and can work with minimal effort and maximum efficiency. But when stress exceeds this optimal level, it is no longer a positive force—it becomes excessive and debilitating, or what Selye termed distress    (from the Latin dis = “bad”). People who reach this level of stress feel burned out; they are fatigued, exhausted, and their performance begins to decline. If the stress remains excessive, health may begin to erode as well (Everly&Lating, 2002).

A graph features a bell curve that has a line going through the middle labeled “Optimal level.” The curve is labeled “eustress” on the left side and “distress” on the right side. The x-axis is labeled “Stress level” and moves from low to high, and the y-axis is labeled “Performance level” and moves from low to high.” The graph shows that stress levels increase with performance levels and that once stress levels reach optimal level, they move from eustress to distress.
As the stress level increases from low to moderate, so does performance (eustress). At the optimal level (the peak of the curve), performance has reached its peak. If stress exceeds the optimal level, it will reach the distress region, where it will become excessive and debilitating, and performance will decline (Everly&Lating, 2002).

The prevalence of stress

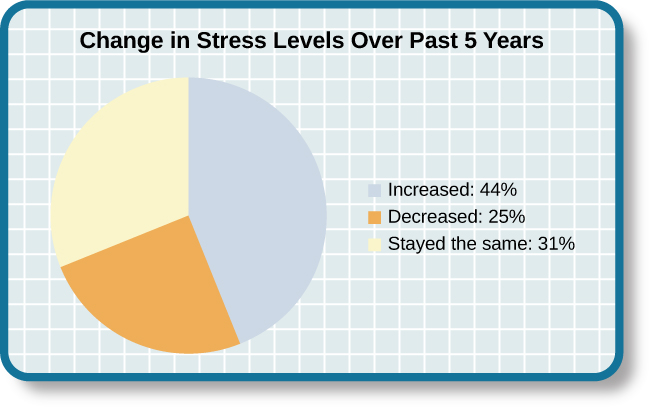
Stress is everywhere and, as shown in [link] , it has been on the rise over the last several years. Each of us is acquainted with stress—some are more familiar than others. In many ways, stress feels like a load you just can’t carry—a feeling you experience when, for example, you have to drive somewhere in a crippling blizzard, when you wake up late the morning of an important job interview, when you run out of money before the next pay period, and before taking an important exam for which you realize you are not fully prepared.

A pie chart is labeled “Change in Stress Levels Over Past 5 Years” and split into three sections. The largest section is labeled “Increased” and accounts for 44% of the pie chart. The second largest section is labeled “Stayed the same” and accounts for 31% of the pie chart. The smallest section is labeled “Decreased” and accounts for 25% of the pie chart.
Nearly half of U.S. adults indicated that their stress levels have increased over the last five years (Neelakantan, 2013).

Questions & Answers

how do you get the 2/50
Abba Reply
number of sport play by 50 student construct discrete data
Aminu Reply
width of the frangebany leaves on how to write a introduction
Theresa Reply
Solve the mean of variance
Veronica Reply
Step 1: Find the mean. To find the mean, add up all the scores, then divide them by the number of scores. ... Step 2: Find each score's deviation from the mean. ... Step 3: Square each deviation from the mean. ... Step 4: Find the sum of squares. ... Step 5: Divide the sum of squares by n – 1 or N.
kenneth
what is error
Yakuba Reply
Is mistake done to something
Vutshila
Hy
anas
hy
What is the life teble
anas
hy
Jibrin
statistics is the analyzing of data
Tajudeen Reply
what is statics?
Zelalem Reply
how do you calculate mean
Gloria Reply
diveving the sum if all values
Shaynaynay
let A1,A2 and A3 events be independent,show that (A1)^c, (A2)^c and (A3)^c are independent?
Fisaye Reply
what is statistics
Akhisani Reply
data collected all over the world
Shaynaynay
construct a less than and more than table
Imad Reply
The sample of 16 students is taken. The average age in the sample was 22 years with astandard deviation of 6 years. Construct a 95% confidence interval for the age of the population.
Aschalew Reply
Bhartdarshan' is an internet-based travel agency wherein customer can see videos of the cities they plant to visit. The number of hits daily is a normally distributed random variable with a mean of 10,000 and a standard deviation of 2,400 a. what is the probability of getting more than 12,000 hits? b. what is the probability of getting fewer than 9,000 hits?
Akshay Reply
Bhartdarshan'is an internet-based travel agency wherein customer can see videos of the cities they plan to visit. The number of hits daily is a normally distributed random variable with a mean of 10,000 and a standard deviation of 2,400. a. What is the probability of getting more than 12,000 hits
Akshay
1
Bright
Sorry i want to learn more about this question
Bright
Someone help
Bright
a= 0.20233 b=0.3384
Sufiyan
a
Shaynaynay
How do I interpret level of significance?
Mohd Reply
It depends on your business problem or in Machine Learning you could use ROC- AUC cruve to decide the threshold value
Shivam
how skewness and kurtosis are used in statistics
Owen Reply
yes what is it
Taneeya
Got questions? Join the online conversation and get instant answers!
Jobilize.com Reply

Get Jobilize Job Search Mobile App in your pocket Now!

Get it on Google Play Download on the App Store Now


Source:  OpenStax, Psychology. OpenStax CNX. Feb 03, 2015 Download for free at https://legacy.cnx.org/content/col11629/1.5
Google Play and the Google Play logo are trademarks of Google Inc.

Notification Switch

Would you like to follow the 'Psychology' conversation and receive update notifications?

Ask