

| << Chapter < Page | Chapter >> Page > |
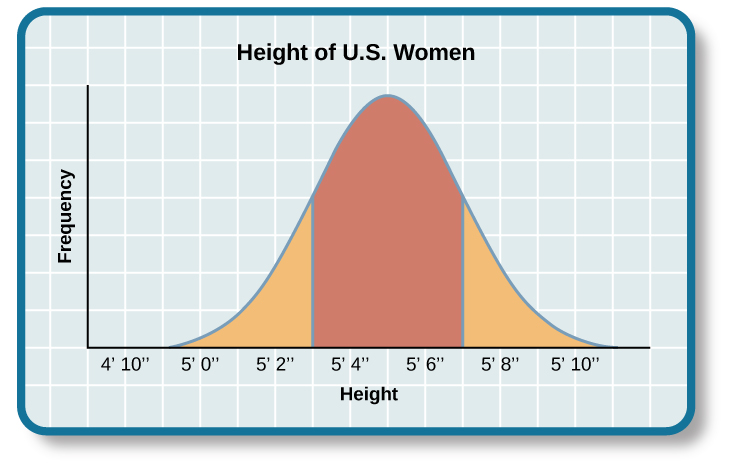
The results of intelligence tests follow the bell curve, a graph in the general shape of a bell. When the bell curve is used in psychological testing, the graph demonstrates a normal distribution of a trait, in this case, intelligence, in the human population. Many human traits naturally follow the bell curve. For example, if you lined up all your female schoolmates according to height, it is likely that a large cluster of them would be the average height for an American woman: 5’4”–5’6”. This cluster would fall in the center of the bell curve, representing the average height for American women ( [link] ). There would be fewer women who stand closer to 4’11”. The same would be true for women of above-average height: those who stand closer to 5’11”. The trick to finding a bell curve in nature is to use a large sample size. Without a large sample size, it is less likely that the bell curve will represent the wider population. A representative sample is a subset of the population that accurately represents the general population. If, for example, you measured the height of the women in your classroom only, you might not actually have a representative sample. Perhaps the women’s basketball team wanted to take this course together, and they are all in your class. Because basketball players tend to be taller than average, the women in your class may not be a good representative sample of the population of American women. But if your sample included all the women at your school, it is likely that their heights would form a natural bell curve.
The same principles apply to intelligence tests scores. Individuals earn a score called an intelligence quotient (IQ). Over the years, different types of IQ tests have evolved, but the way scores are interpreted remains the same. The average IQ score on an IQ test is 100. Standard deviations describe how data are dispersed in a population and give context to large data sets. The bell curve uses the standard deviation to show how all scores are dispersed from the average score ( [link] ). In modern IQ testing, one standard deviation is 15 points. So a score of 85 would be described as “one standard deviation below the mean.” How would you describe a score of 115 and a score of 70? Any IQ score that falls within one standard deviation above and below the mean (between 85 and 115) is considered average, and 82% of the population has IQ scores in this range. An IQ score of 130 or above is considered a superior level.
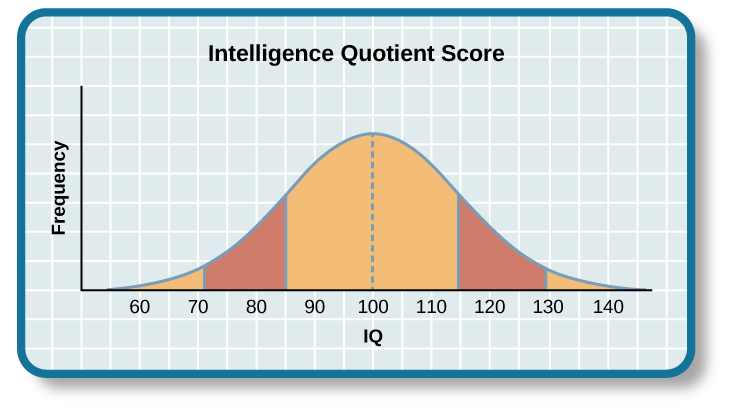
Only 2.2% of the population has an IQ score below 70 (American Psychological Association [APA], 2013). A score of 70 or below indicates significant cognitive delays, major deficits in adaptive functioning, and difficulty meeting “community standards of personal independence and social responsibility” when compared to same-aged peers (APA, 2013, p. 37). An individual in this IQ range would be considered to have an intellectual disability and exhibit deficits in intellectual functioning and adaptive behavior (American Association on Intellectual and Developmental Disabilities, 2013). Formerly known as mental retardation, the accepted term now is intellectual disability, and it has four subtypes: mild, moderate, severe, and profound ( [link] ). The Diagnostic and Statistical Manual of Psychological Disorders lists criteria for each subgroup (APA, 2013).
Notification Switch
Would you like to follow the 'Psychology' conversation and receive update notifications?

|
|
|
|
|

|
|

|
|

|
|

|
|

|
|

|
|

|
|

|
|

|
|

|