

| << Chapter < Page | Chapter >> Page > |
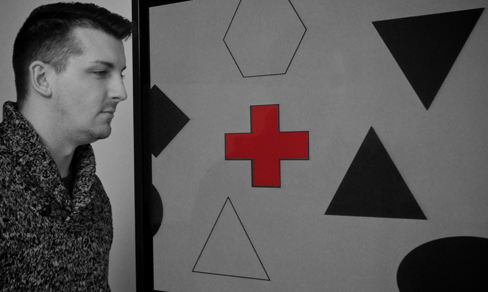
In a similar experiment, researchers tested inattentional blindness by asking participants to observe images moving across a computer screen. They were instructed to focus on either white or black objects, disregarding the other color. When a red cross passed across the screen, about one third of subjects did not notice it ( [link] ) (Most, Simons, Scholl,&Chabris, 2000).
Motivation can also affect perception. Have you ever been expecting a really important phone call and, while taking a shower, you think you hear the phone ringing, only to discover that it is not? If so, then you have experienced how motivation to detect a meaningful stimulus can shift our ability to discriminate between a true sensory stimulus and background noise. The ability to identify a stimulus when it is embedded in a distracting background is called signal detection theory . This might also explain why a mother is awakened by a quiet murmur from her baby but not by other sounds that occur while she is asleep. Signal detection theory has practical applications, such as increasing air traffic controller accuracy. Controllers need to be able to detect planes among many signals (blips) that appear on the radar screen and follow those planes as they move through the sky. In fact, the original work of the researcher who developed signal detection theory was focused on improving the sensitivity of air traffic controllers to plane blips (Swets, 1964).
Our perceptions can also be affected by our beliefs, values, prejudices, expectations, and life experiences. As you will see later in this chapter, individuals who are deprived of the experience of binocular vision during critical periods of development have trouble perceiving depth (Fawcett, Wang,&Birch, 2005). The shared experiences of people within a given cultural context can have pronounced effects on perception. For example, Marshall Segall, Donald Campbell, and Melville Herskovits (1963) published the results of a multinational study in which they demonstrated that individuals from Western cultures were more prone to experience certain types of visual illusions than individuals from non-Western cultures, and vice versa. One such illusion that Westerners were more likely to experience was the Müller-Lyer illusion ( [link] ): The lines appear to be different lengths, but they are actually the same length.
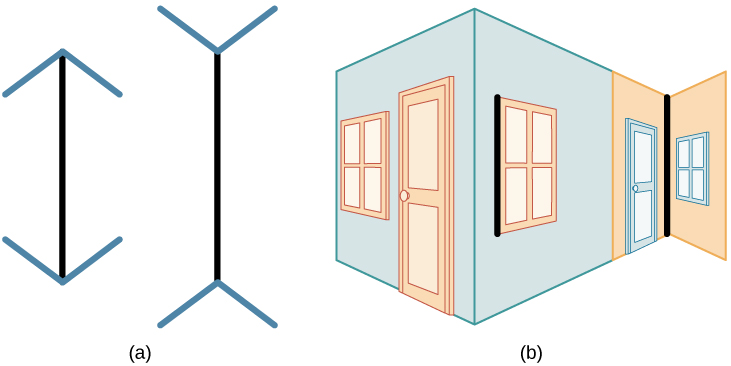
These perceptual differences were consistent with differences in the types of environmental features experienced on a regular basis by people in a given cultural context. People in Western cultures, for example, have a perceptual context of buildings with straight lines, what Segall’s study called a carpentered world (Segall et al., 1966). In contrast, people from certain non-Western cultures with an uncarpentered view, such as the Zulu of South Africa, whose villages are made up of round huts arranged in circles, are less susceptible to this illusion (Segall et al., 1999). It is not just vision that is affected by cultural factors. Indeed, research has demonstrated that the ability to identify an odor, and rate its pleasantness and its intensity, varies cross-culturally (Ayabe-Kanamura, Saito, Distel, Martínez-Gómez,&Hudson, 1998).
Children described as thrill seekers are more likely to show taste preferences for intense sour flavors (Liem, Westerbeek, Wolterink, Kok,&de Graaf, 2004), which suggests that basic aspects of personality might affect perception. Furthermore, individuals who hold positive attitudes toward reduced-fat foods are more likely to rate foods labeled as reduced fat as tasting better than people who have less positive attitudes about these products (Aaron, Mela,&Evans, 1994).
Sensation occurs when sensory receptors detect sensory stimuli. Perception involves the organization, interpretation, and conscious experience of those sensations. All sensory systems have both absolute and difference thresholds, which refer to the minimum amount of stimulus energy or the minimum amount of difference in stimulus energy required to be detected about 50% of the time, respectively. Sensory adaptation, selective attention, and signal detection theory can help explain what is perceived and what is not. In addition, our perceptions are affected by a number of factors, including beliefs, values, prejudices, culture, and life experiences.
Think about a time when you failed to notice something around you because your attention was focused elsewhere. If someone pointed it out, were you surprised that you hadn’t noticed it right away?
Notification Switch
Would you like to follow the 'Psychology' conversation and receive update notifications?

|
|
|
|
|

|
|

|
|

|
|

|
|

|
|

|
|

|
|

|
|

|
|

|