<< Chapter < Page Chapter >> Page >

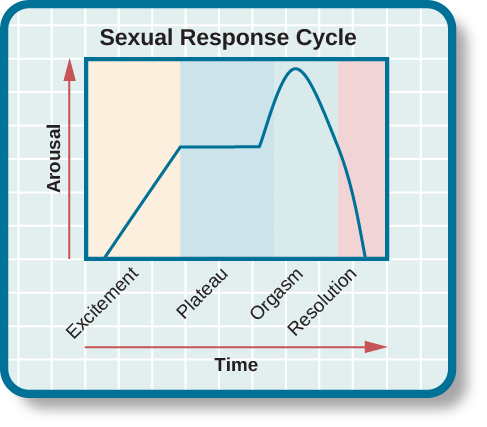
Based on these observations, Masters and Johnson divided the sexual response cycle    into four phases that are fairly similar in men and women: excitement, plateau, orgasm, and resolution ( [link] ). The excitement    phase is the arousal phase of the sexual response cycle, and it is marked by erection of the penis or clitoris and lubrication and expansion of the vaginal canal. During plateau    , women experience further swelling of the vagina and increased blood flow to the labia minora, and men experience full erection and often exhibit pre-ejaculatory fluid. Both men and women experience increases in muscle tone during this time. Orgasm is marked in women by rhythmic contractions of the pelvis and uterus along with increased muscle tension. In men, pelvic contractions are accompanied by a buildup of seminal fluid near the urethra that is ultimately forced out by contractions of genital muscles, (i.e., ejaculation). Resolution is the relatively rapid return to an unaroused state accompanied by a decrease in blood pressure and muscular relaxation. While many women can quickly repeat the sexual response cycle, men must pass through a longer refractory period as part of resolution. The refractory period    is a period of time that follows an orgasm during which an individual is incapable of experiencing another orgasm. In men, the duration of the refractory period can vary dramatically from individual to individual with some refractory periods as short as several minutes and others as long as a day. As men age, their refractory periods tend to span longer periods of time.

A graph titled “Sexual response cycle” has an x-axis labeled “time” and a y-axis labeled “arousal.” Four phases are depicted. In the “excitement” phase the arousal level increases from the bottom to midway on the graph. In the “plateau” phase the arousal level remains mostly steady at the midpoint of the graph and then begins to rise at the end of the plateau phase. At the “orgasm” phase, the arousal level sharply increases, peaks at the top of the graph, and then declines to the midway point. In the “resolution” phase the graph drops from the midway point to the bottom.
This graph illustrates the different phases of the sexual response cycle as described by Masters and Johnson.

In addition to the insights that their research provided with regards to the sexual response cycle and the multi-orgasmic potential of women, Masters and Johnson also collected important information about reproductive anatomy. Their research demonstrated the oft-cited statistic of the average size of a flaccid and an erect penis (3 and 6 inches, respectively) as well as dispelling long-held beliefs about relationships between the size of a man’s erect penis and his ability to provide sexual pleasure to his female partner. Furthermore, they determined that the vagina is a very elastic structure that can conform to penises of various sizes (Hock, 2008).

Sexual orientation

As mentioned earlier, a person’s sexual orientation is their emotional and erotic attraction toward another individual ( [link] ). While the majority of people identify as heterosexual, there is a sizable population of people within the United States who identify as either homosexual or bisexual. Research suggests that somewhere between 3% and 10% of the population identifies as homosexual (Kinsey, Pomeroy,&Martin, 1948; LeVay, 1996; Pillard&Bailey, 1995).

A photograph shows two people holding hands.
Between 3% and 10% of the adult population identifies as homosexual. (credit: Till Krech)

Issues of sexual orientation have long fascinated scientists interested in determining what causes one individual to be heterosexual while another is homosexual. For many years, people believed that these differences arose because of different socialization and familial experiences. However, research has consistently demonstrated that the family backgrounds and experiences are very similar among heterosexuals and homosexuals (Bell, Weinberg,&Hammersmith, 1981; Ross&Arrindell, 1988).

Questions & Answers

how do you get the 2/50
Abba Reply
number of sport play by 50 student construct discrete data
Aminu Reply
width of the frangebany leaves on how to write a introduction
Theresa Reply
Solve the mean of variance
Veronica Reply
Step 1: Find the mean. To find the mean, add up all the scores, then divide them by the number of scores. ... Step 2: Find each score's deviation from the mean. ... Step 3: Square each deviation from the mean. ... Step 4: Find the sum of squares. ... Step 5: Divide the sum of squares by n – 1 or N.
kenneth
what is error
Yakuba Reply
Is mistake done to something
Vutshila
Hy
anas
hy
What is the life teble
anas
hy
Jibrin
statistics is the analyzing of data
Tajudeen Reply
what is statics?
Zelalem Reply
how do you calculate mean
Gloria Reply
diveving the sum if all values
Shaynaynay
let A1,A2 and A3 events be independent,show that (A1)^c, (A2)^c and (A3)^c are independent?
Fisaye Reply
what is statistics
Akhisani Reply
data collected all over the world
Shaynaynay
construct a less than and more than table
Imad Reply
The sample of 16 students is taken. The average age in the sample was 22 years with astandard deviation of 6 years. Construct a 95% confidence interval for the age of the population.
Aschalew Reply
Bhartdarshan' is an internet-based travel agency wherein customer can see videos of the cities they plant to visit. The number of hits daily is a normally distributed random variable with a mean of 10,000 and a standard deviation of 2,400 a. what is the probability of getting more than 12,000 hits? b. what is the probability of getting fewer than 9,000 hits?
Akshay Reply
Bhartdarshan'is an internet-based travel agency wherein customer can see videos of the cities they plan to visit. The number of hits daily is a normally distributed random variable with a mean of 10,000 and a standard deviation of 2,400. a. What is the probability of getting more than 12,000 hits
Akshay
1
Bright
Sorry i want to learn more about this question
Bright
Someone help
Bright
a= 0.20233 b=0.3384
Sufiyan
a
Shaynaynay
How do I interpret level of significance?
Mohd Reply
It depends on your business problem or in Machine Learning you could use ROC- AUC cruve to decide the threshold value
Shivam
how skewness and kurtosis are used in statistics
Owen Reply
yes what is it
Taneeya
Got questions? Join the online conversation and get instant answers!
Jobilize.com Reply

Get Jobilize Job Search Mobile App in your pocket Now!

Get it on Google Play Download on the App Store Now


Source:  OpenStax, Psychology. OpenStax CNX. Feb 03, 2015 Download for free at https://legacy.cnx.org/content/col11629/1.5
Google Play and the Google Play logo are trademarks of Google Inc.

Notification Switch

Would you like to follow the 'Psychology' conversation and receive update notifications?

Ask