<< Chapter < Page Chapter >> Page >

Extensions of drive theory take into account levels of arousal as potential motivators. As you recall from your study of learning, these theories assert that there is an optimal level of arousal that we all try to maintain ( [link] ). If we are underaroused, we become bored and will seek out some sort of stimulation. On the other hand, if we are overaroused, we will engage in behaviors to reduce our arousal (Berlyne, 1960). Most students have experienced this need to maintain optimal levels of arousal over the course of their academic career. Think about how much stress students experience toward the end of spring semester. They feel overwhelmed with seemingly endless exams, papers, and major assignments that must be completed on time. They probably yearn for the rest and relaxation that awaits them over the extended summer break. However, once they finish the semester, it doesn’t take too long before they begin to feel bored. Generally, by the time the next semester is beginning in the fall, many students are quite happy to return to school. This is an example of how arousal theory works.

A line graph has an x-axis labeled “arousal level” with an arrow indicating “low” to “high” and a y-axis labeled “performance quality” with an arrow indicating “low” to “high.” A curve charts optimal arousal. Where arousal level and performance quality are both “low,” the curve is low and labeled “boredom or apathy.” Where arousal level is “medium” and “performance quality is “medium,” the curve peaks and is labeled “optimal level.” Where the arousal level is “high” and the performance quality is “low,” the curve is low and is labeled “high anxiety.”
The concept of optimal arousal in relation to performance on a task is depicted here. Performance is maximized at the optimal level of arousal, and it tapers off during under- and overarousal.

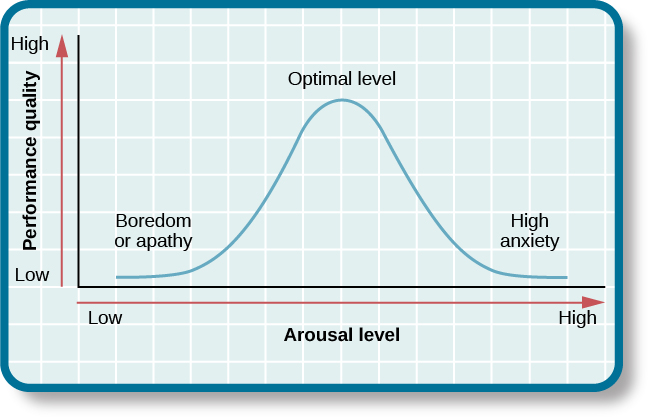
So what is the optimal level of arousal? What level leads to the best performance? Research shows that moderate arousal is generally best; when arousal is very high or very low, performance tends to suffer (Yerkes&Dodson, 1908). Think of your arousal level regarding taking an exam for this class. If your level is very low, such as boredom and apathy, your performance will likely suffer. Similarly, a very high level, such as extreme anxiety, can be paralyzing and hinder performance. Consider the example of a softball team facing a tournament. They are favored to win their first game by a large margin, so they go into the game with a lower level of arousal and get beat by a less skilled team.

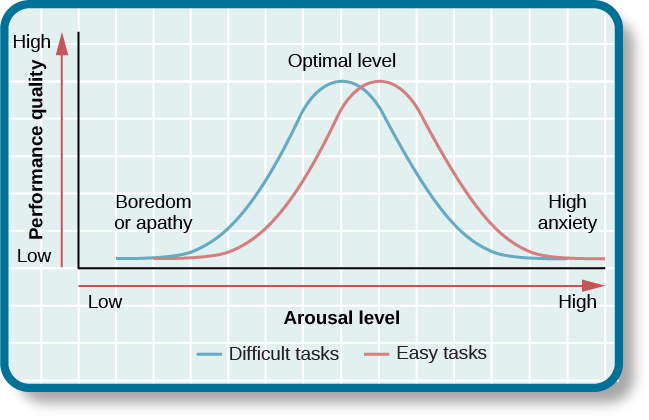
But optimal arousal level is more complex than a simple answer that the middle level is always best. Researchers Robert Yerkes (pronounced “Yerk-EES”) and John Dodson discovered that the optimal arousal level depends on the complexity and difficulty of the task to be performed ( [link] ). This relationship is known as Yerkes-Dodson law    , which holds that a simple task is performed best when arousal levels are relatively high and complex tasks are best performed when arousal levels are lower.

A line graph has an x-axis labeled “arousal level” with an arrow indicating “low” to “high” and a y-axis labeled “performance quality” with an arrow indicating “low” to “high.” Two curves charts optimal arousal, one for difficult tasks and the other for easy tasks. The optimal level for easy tasks is reached with slightly higher arousal levels than for difficult tasks.
Task performance is best when arousal levels are in a middle range, with difficult tasks best performed under lower levels of arousal and simple tasks best performed under higher levels of arousal.

Self-efficacy and social motives

Self-efficacy is an individual’s belief in her own capability to complete a task, which may include a previous successful completion of the exact task or a similar task. Albert Bandura (1994) theorized that an individual’s sense of self-efficacy plays a pivotal role in motivating behavior. Bandura argues that motivation derives from expectations that we have about the consequences of our behaviors, and ultimately, it is the appreciation of our capacity to engage in a given behavior that will determine what we do and the future goals that we set for ourselves. For example, if you have a sincere belief in your ability to achieve at the highest level, you are more likely to take on challenging tasks and to not let setbacks dissuade you from seeing the task through to the end.

Questions & Answers

differentiate between demand and supply giving examples
Lambiv Reply
differentiated between demand and supply using examples
Lambiv
what is labour ?
Lambiv
how will I do?
Venny Reply
how is the graph works?I don't fully understand
Rezat Reply
information
Eliyee
devaluation
Eliyee
t
WARKISA
hi guys good evening to all
Lambiv
multiple choice question
Aster Reply
appreciation
Eliyee
explain perfect market
Lindiwe Reply
In economics, a perfect market refers to a theoretical construct where all participants have perfect information, goods are homogenous, there are no barriers to entry or exit, and prices are determined solely by supply and demand. It's an idealized model used for analysis,
Ezea
What is ceteris paribus?
Shukri Reply
other things being equal
AI-Robot
When MP₁ becomes negative, TP start to decline. Extuples Suppose that the short-run production function of certain cut-flower firm is given by: Q=4KL-0.6K2 - 0.112 • Where is quantity of cut flower produced, I is labour input and K is fixed capital input (K-5). Determine the average product of lab
Kelo
Extuples Suppose that the short-run production function of certain cut-flower firm is given by: Q=4KL-0.6K2 - 0.112 • Where is quantity of cut flower produced, I is labour input and K is fixed capital input (K-5). Determine the average product of labour (APL) and marginal product of labour (MPL)
Kelo
yes,thank you
Shukri
Can I ask you other question?
Shukri
what is monopoly mean?
Habtamu Reply
What is different between quantity demand and demand?
Shukri Reply
Quantity demanded refers to the specific amount of a good or service that consumers are willing and able to purchase at a give price and within a specific time period. Demand, on the other hand, is a broader concept that encompasses the entire relationship between price and quantity demanded
Ezea
ok
Shukri
how do you save a country economic situation when it's falling apart
Lilia Reply
what is the difference between economic growth and development
Fiker Reply
Economic growth as an increase in the production and consumption of goods and services within an economy.but Economic development as a broader concept that encompasses not only economic growth but also social & human well being.
Shukri
production function means
Jabir
What do you think is more important to focus on when considering inequality ?
Abdisa Reply
any question about economics?
Awais Reply
sir...I just want to ask one question... Define the term contract curve? if you are free please help me to find this answer 🙏
Asui
it is a curve that we get after connecting the pareto optimal combinations of two consumers after their mutually beneficial trade offs
Awais
thank you so much 👍 sir
Asui
In economics, the contract curve refers to the set of points in an Edgeworth box diagram where both parties involved in a trade cannot be made better off without making one of them worse off. It represents the Pareto efficient allocations of goods between two individuals or entities, where neither p
Cornelius
In economics, the contract curve refers to the set of points in an Edgeworth box diagram where both parties involved in a trade cannot be made better off without making one of them worse off. It represents the Pareto efficient allocations of goods between two individuals or entities,
Cornelius
Suppose a consumer consuming two commodities X and Y has The following utility function u=X0.4 Y0.6. If the price of the X and Y are 2 and 3 respectively and income Constraint is birr 50. A,Calculate quantities of x and y which maximize utility. B,Calculate value of Lagrange multiplier. C,Calculate quantities of X and Y consumed with a given price. D,alculate optimum level of output .
Feyisa Reply
Answer
Feyisa
c
Jabir
the market for lemon has 10 potential consumers, each having an individual demand curve p=101-10Qi, where p is price in dollar's per cup and Qi is the number of cups demanded per week by the i th consumer.Find the market demand curve using algebra. Draw an individual demand curve and the market dema
Gsbwnw Reply
suppose the production function is given by ( L, K)=L¼K¾.assuming capital is fixed find APL and MPL. consider the following short run production function:Q=6L²-0.4L³ a) find the value of L that maximizes output b)find the value of L that maximizes marginal product
Abdureman
types of unemployment
Yomi Reply
What is the difference between perfect competition and monopolistic competition?
Mohammed
Got questions? Join the online conversation and get instant answers!
Jobilize.com Reply

Get Jobilize Job Search Mobile App in your pocket Now!

Get it on Google Play Download on the App Store Now


Source:  OpenStax, Psychology. OpenStax CNX. Feb 03, 2015 Download for free at https://legacy.cnx.org/content/col11629/1.5
Google Play and the Google Play logo are trademarks of Google Inc.

Notification Switch

Would you like to follow the 'Psychology' conversation and receive update notifications?

Ask