<< Chapter < Page Chapter >> Page >
A graph has an x-axis labeled “time” and a y-axis labeled “voltage. A line illustrates brainwaves, with two areas labeled “sleep spindle” and “k-complex”. The area labeled “sleep spindle” has decreased wavelength and moderately increased amplitude, while the area labeled “k-complex” has significantly high amplitude and longer wavelength.
Stage 2 sleep is characterized by the appearance of both sleep spindles and K-complexes.

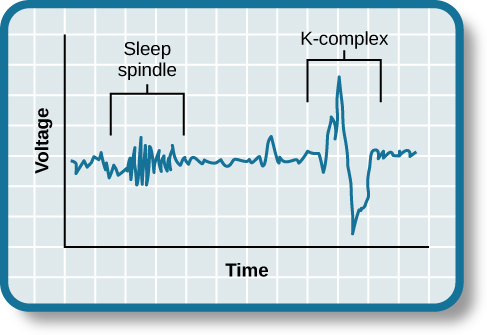
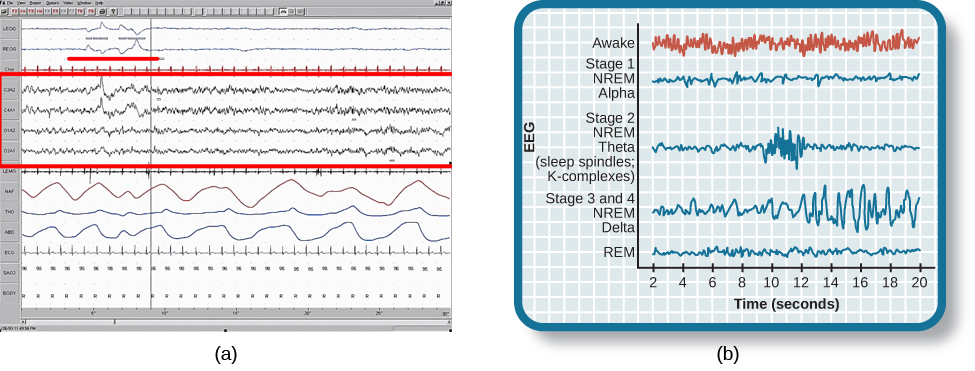
Stage 3 and stage 4 of sleep are often referred to as deep sleep or slow-wave sleep because these stages are characterized by low frequency (up to 4 Hz), high amplitude delta waves ( [link] ). During this time, an individual’s heart rate and respiration slow dramatically. It is much more difficult to awaken someone from sleep during stage 3 and stage 4 than during earlier stages. Interestingly, individuals who have increased levels of alpha brain wave activity (more often associated with wakefulness and transition into stage 1 sleep) during stage 3 and stage 4 often report that they do not feel refreshed upon waking, regardless of how long they slept (Stone, Taylor, McCrae, Kalsekar,&Lichstein, 2008).

Polysonograph a shows the pattern of delta waves, which are low frequency and high amplitude. Delta waves are found mostly in stages 3 and 4 of sleep. Chart b shows brainwaves at various stages of sleep, with stages 3 and 4 highlighted.
(a) Delta waves, which are low frequency and high amplitude, characterize (b) slow-wave stage 3 and stage 4 sleep.

Rem sleep

As mentioned earlier, REM sleep is marked by rapid movements of the eyes. The brain waves associated with this stage of sleep are very similar to those observed when a person is awake, as shown in [link] , and this is the period of sleep in which dreaming occurs. It is also associated with paralysis of muscle systems in the body with the exception of those that make circulation and respiration possible. Therefore, no movement of voluntary muscles occurs during REM sleep in a normal individual; REM sleep is often referred to as paradoxical sleep because of this combination of high brain activity and lack of muscle tone. Like NREM sleep, REM has been implicated in various aspects of learning and memory (Wagner, Gais,&Born, 2001), although there is disagreement within the scientific community about how important both NREM and REM sleep are for normal learning and memory (Siegel, 2001).

Chart A is a polysonograph with the period of rapid eye movement (REM) highlighted.Chart b is a shows brainwaves at various stages of sleep, with the “awake” stage highlighted to show its similarity to the wave pattern of “REM” in part A.
(a) A period of rapid eye movement is marked by the short red line segment. The brain waves associated with REM sleep, outlined in the red box in (a), look very similar to those seen (b) during wakefulness.

If people are deprived of REM sleep and then allowed to sleep without disturbance, they will spend more time in REM sleep in what would appear to be an effort to recoup the lost time in REM. This is known as the REM rebound, and it suggests that REM sleep is also homeostatically regulated. Aside from the role that REM sleep may play in processes related to learning and memory, REM sleep may also be involved in emotional processing and regulation. In such instances, REM rebound may actually represent an adaptive response to stress in nondepressed individuals by suppressing the emotional salience of aversive events that occurred in wakefulness (Suchecki, Tiba,&Machado, 2012).

While sleep deprivation in general is associated with a number of negative consequences (Brown, 2012), the consequences of REM deprivation appear to be less profound (as discussed in Siegel, 2001). In fact, some have suggested that REM deprivation can actually be beneficial in some circumstances. For instance, REM sleep deprivation has been demonstrated to improve symptoms of people suffering from major depression, and many effective antidepressant medications suppress REM sleep (Riemann, Berger,&Volderholzer, 2001; Vogel, 1975).

Questions & Answers

how do you get the 2/50
Abba Reply
number of sport play by 50 student construct discrete data
Aminu Reply
width of the frangebany leaves on how to write a introduction
Theresa Reply
Solve the mean of variance
Veronica Reply
Step 1: Find the mean. To find the mean, add up all the scores, then divide them by the number of scores. ... Step 2: Find each score's deviation from the mean. ... Step 3: Square each deviation from the mean. ... Step 4: Find the sum of squares. ... Step 5: Divide the sum of squares by n – 1 or N.
kenneth
what is error
Yakuba Reply
Is mistake done to something
Vutshila
Hy
anas
hy
What is the life teble
anas
hy
Jibrin
statistics is the analyzing of data
Tajudeen Reply
what is statics?
Zelalem Reply
how do you calculate mean
Gloria Reply
diveving the sum if all values
Shaynaynay
let A1,A2 and A3 events be independent,show that (A1)^c, (A2)^c and (A3)^c are independent?
Fisaye Reply
what is statistics
Akhisani Reply
data collected all over the world
Shaynaynay
construct a less than and more than table
Imad Reply
The sample of 16 students is taken. The average age in the sample was 22 years with astandard deviation of 6 years. Construct a 95% confidence interval for the age of the population.
Aschalew Reply
Bhartdarshan' is an internet-based travel agency wherein customer can see videos of the cities they plant to visit. The number of hits daily is a normally distributed random variable with a mean of 10,000 and a standard deviation of 2,400 a. what is the probability of getting more than 12,000 hits? b. what is the probability of getting fewer than 9,000 hits?
Akshay Reply
Bhartdarshan'is an internet-based travel agency wherein customer can see videos of the cities they plan to visit. The number of hits daily is a normally distributed random variable with a mean of 10,000 and a standard deviation of 2,400. a. What is the probability of getting more than 12,000 hits
Akshay
1
Bright
Sorry i want to learn more about this question
Bright
Someone help
Bright
a= 0.20233 b=0.3384
Sufiyan
a
Shaynaynay
How do I interpret level of significance?
Mohd Reply
It depends on your business problem or in Machine Learning you could use ROC- AUC cruve to decide the threshold value
Shivam
how skewness and kurtosis are used in statistics
Owen Reply
yes what is it
Taneeya
Got questions? Join the online conversation and get instant answers!
Jobilize.com Reply

Get Jobilize Job Search Mobile App in your pocket Now!

Get it on Google Play Download on the App Store Now


Source:  OpenStax, Psychology. OpenStax CNX. Feb 03, 2015 Download for free at https://legacy.cnx.org/content/col11629/1.5
Google Play and the Google Play logo are trademarks of Google Inc.

Notification Switch

Would you like to follow the 'Psychology' conversation and receive update notifications?

Ask