<< Chapter < Page Chapter >> Page >

We all experience fluctuations in our weight from time to time, but generally, most people’s weights fluctuate within a narrow margin, in the absence of extreme changes in diet and/or physical activity. This observation led some to propose a set-point theory of body weight regulation. The set-point theory asserts that each individual has an ideal body weight, or set point, which is resistant to change. This set-point is genetically predetermined and efforts to move our weight significantly from the set-point are resisted by compensatory changes in energy intake and/or expenditure (Speakman et al., 2011).

Some of the predictions generated from this particular theory have not received empirical support. For example, there are no changes in metabolic rate between individuals who had recently lost significant amounts of weight and a control group (Weinsier et al., 2000). In addition, the set-point theory fails to account for the influence of social and environmental factors in the regulation of body weight (Martin-Gronert&Ozanne, 2013; Speakman et al., 2011). Despite these limitations, set-point theory is still often used as a simple, intuitive explanation of how body weight is regulated.

Obesity

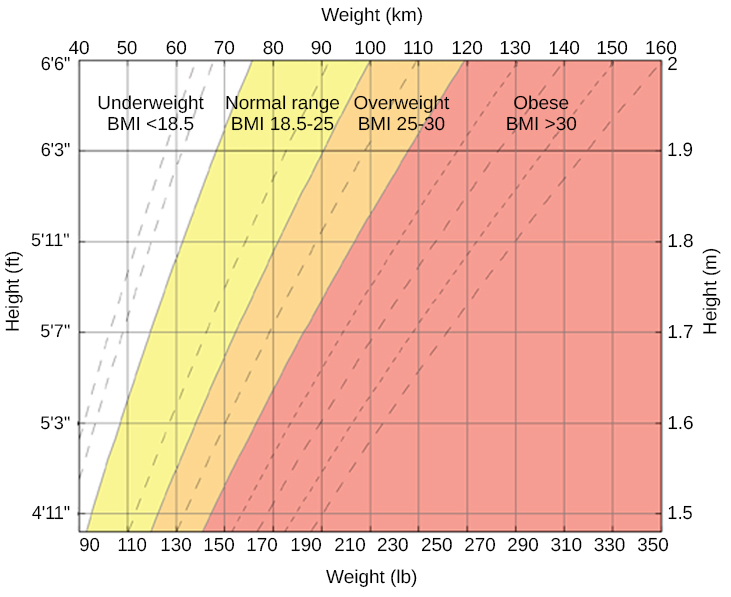
When someone weighs more than what is generally accepted as healthy for a given height, they are considered overweight or obese. According to the Centers for Disease Control and Prevention (CDC), an adult with a body mass index (BMI) between 25 and 29.9 is considered overweight    ( [link] ). An adult with a BMI of 30 or higher is considered obese    (Centers for Disease Control and Prevention [CDC], 2012). People who are so overweight that they are at risk for death are classified as morbidly obese. Morbid obesity is defined as having a BMI over 40. Note that although BMI has been used as a healthy weight indicator by the World Health Organization (WHO), the CDC, and other groups, its value as an assessment tool has been questioned. The BMI is most useful for studying populations, which is the work of these organizations. It is less useful in assessing an individual since height and weight measurements fail to account for important factors like fitness level. An athlete, for example, may have a high BMI because the tool doesn’t distinguish between the body’s percentage of fat and muscle in a person’s weight.

A chart has an x-axis labeled “weight” (pounds/kilograms) and a y-axis labeled “height” (meters and feet/inches). Four areas are shaded different colors indicating the BMI for ranges of weight and height. The “underweight BMI <18.5” area begins at approximately 90 pounds and 4’11” and extends to approximately 160 pounds and 6’6”. The “normal range BMI 18.5–25” area covers approximately 90–120 pounds at height 4’11” and extends to approximately 160–220 pounds at height 6’6”. The “overweight BMI 25–30” area covers approximately 120–140 pounds at height 4’11” and extends to approximately 220–265 pounds at height 6’6”. The “obese range BMI >30” area covers approximately 140–350 pounds at height 4’11” and extends to approximately 265–350 pounds at height 6’6.”
This chart shows how adult BMI is calculated. Individuals find their height on the y -axis and their weight on the x -axis to determine their BMI.

Being extremely overweight or obese is a risk factor for several negative health consequences. These include, but are not limited to, an increased risk for cardiovascular disease, stroke, Type 2 diabetes, liver disease, sleep apnea, colon cancer, breast cancer, infertility, and arthritis. Given that it is estimated that in the United States around one-third of the adult population is obese and that nearly two-thirds of adults and one in six children qualify as overweight (CDC, 2012), there is substantial interest in trying to understand how to combat this important public health concern.

Questions & Answers

how do you get the 2/50
Abba Reply
number of sport play by 50 student construct discrete data
Aminu Reply
width of the frangebany leaves on how to write a introduction
Theresa Reply
Solve the mean of variance
Veronica Reply
Step 1: Find the mean. To find the mean, add up all the scores, then divide them by the number of scores. ... Step 2: Find each score's deviation from the mean. ... Step 3: Square each deviation from the mean. ... Step 4: Find the sum of squares. ... Step 5: Divide the sum of squares by n – 1 or N.
kenneth
what is error
Yakuba Reply
Is mistake done to something
Vutshila
Hy
anas
hy
What is the life teble
anas
hy
Jibrin
statistics is the analyzing of data
Tajudeen Reply
what is statics?
Zelalem Reply
how do you calculate mean
Gloria Reply
diveving the sum if all values
Shaynaynay
let A1,A2 and A3 events be independent,show that (A1)^c, (A2)^c and (A3)^c are independent?
Fisaye Reply
what is statistics
Akhisani Reply
data collected all over the world
Shaynaynay
construct a less than and more than table
Imad Reply
The sample of 16 students is taken. The average age in the sample was 22 years with astandard deviation of 6 years. Construct a 95% confidence interval for the age of the population.
Aschalew Reply
Bhartdarshan' is an internet-based travel agency wherein customer can see videos of the cities they plant to visit. The number of hits daily is a normally distributed random variable with a mean of 10,000 and a standard deviation of 2,400 a. what is the probability of getting more than 12,000 hits? b. what is the probability of getting fewer than 9,000 hits?
Akshay Reply
Bhartdarshan'is an internet-based travel agency wherein customer can see videos of the cities they plan to visit. The number of hits daily is a normally distributed random variable with a mean of 10,000 and a standard deviation of 2,400. a. What is the probability of getting more than 12,000 hits
Akshay
1
Bright
Sorry i want to learn more about this question
Bright
Someone help
Bright
a= 0.20233 b=0.3384
Sufiyan
a
Shaynaynay
How do I interpret level of significance?
Mohd Reply
It depends on your business problem or in Machine Learning you could use ROC- AUC cruve to decide the threshold value
Shivam
how skewness and kurtosis are used in statistics
Owen Reply
yes what is it
Taneeya
Got questions? Join the online conversation and get instant answers!
Jobilize.com Reply

Get Jobilize Job Search Mobile App in your pocket Now!

Get it on Google Play Download on the App Store Now


Source:  OpenStax, Psychology. OpenStax CNX. Feb 03, 2015 Download for free at https://legacy.cnx.org/content/col11629/1.5
Google Play and the Google Play logo are trademarks of Google Inc.

Notification Switch

Would you like to follow the 'Psychology' conversation and receive update notifications?

Ask