<< Chapter < Page Chapter >> Page >

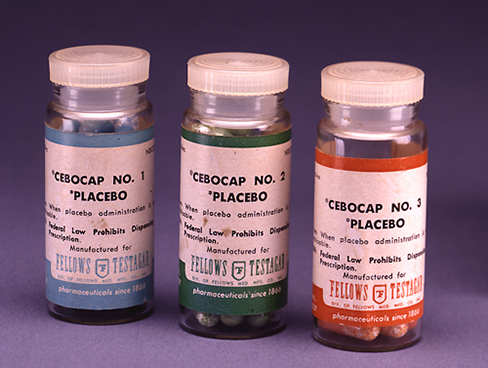
Why is that? Imagine that you are a participant in this study, and you have just taken a pill that you think will improve your mood. Because you expect the pill to have an effect, you might feel better simply because you took the pill and not because of any drug actually contained in the pill—this is the placebo effect.

To make sure that any effects on mood are due to the drug and not due to expectations, the control group receives a placebo (in this case a sugar pill). Now everyone gets a pill, and once again neither the researcher nor the experimental participants know who got the drug and who got the sugar pill. Any differences in mood between the experimental and control groups can now be attributed to the drug itself rather than to experimenter bias or participant expectations ( [link] ).

A photograph shows three glass bottles of pills labeled as placebos.
Providing the control group with a placebo treatment protects against bias caused by expectancy. (credit: Elaine and Arthur Shapiro)

Independent and dependent variables

In a research experiment, we strive to study whether changes in one thing cause changes in another. To achieve this, we must pay attention to two important variables, or things that can be changed, in any experimental study: the independent variable and the dependent variable. An independent variable    is manipulated or controlled by the experimenter. In a well-designed experimental study, the independent variable is the only important difference between the experimental and control groups. In our example of how violent television programs affect children’s display of violent behavior, the independent variable is the type of program—violent or nonviolent—viewed by participants in the study ( [link] ). A dependent variable    is what the researcher measures to see how much effect the independent variable had. In our example, the dependent variable is the number of violent acts displayed by the experimental participants.

A box labeled “independent variable: type of television programming viewed” contains a photograph of a person shooting an automatic weapon. An arrow labeled “influences change in the…” leads to a second box. The second box is labeled “dependent variable: violent behavior displayed” and has a photograph of a child pointing a toy gun.
In an experiment, manipulations of the independent variable are expected to result in changes in the dependent variable. (credit “automatic weapon”: modification of work by Daniel Oines; credit “toy gun”: modification of work by Emran Kassim)

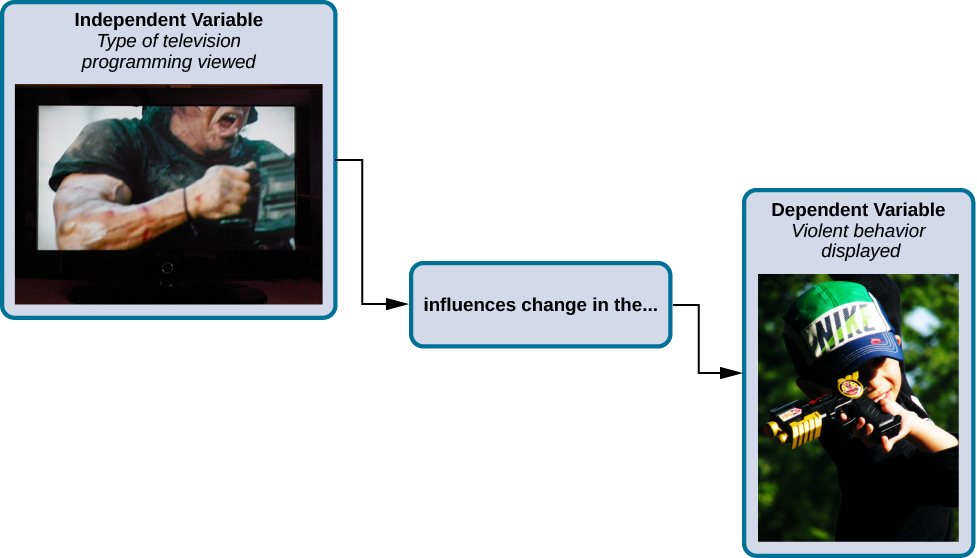
We expect that the dependent variable will change as a function of the independent variable. In other words, the dependent variable depends on the independent variable. A good way to think about the relationship between the independent and dependent variables is with this question: What effect does the independent variable have on the dependent variable? Returning to our example, what effect does watching a half hour of violent television programming or nonviolent television programming have on the number of incidents of physical aggression displayed on the playground?

Selecting and assigning experimental participants

Now that our study is designed, we need to obtain a sample of individuals to include in our experiment. Our study involves human participants so we need to determine who to include. Participants are the subjects of psychological research, and as the name implies, individuals who are involved in psychological research actively participate in the process. Often, psychological research projects rely on college students to serve as participants. In fact, the vast majority of research in psychology subfields has historically involved students as research participants (Sears, 1986; Arnett, 2008). But are college students truly representative of the general population? College students tend to be younger, more educated, more liberal, and less diverse than the general population. Although using students as test subjects is an accepted practice, relying on such a limited pool of research participants can be problematic because it is difficult to generalize findings to the larger population.

Questions & Answers

how do you get the 2/50
Abba Reply
number of sport play by 50 student construct discrete data
Aminu Reply
width of the frangebany leaves on how to write a introduction
Theresa Reply
Solve the mean of variance
Veronica Reply
Step 1: Find the mean. To find the mean, add up all the scores, then divide them by the number of scores. ... Step 2: Find each score's deviation from the mean. ... Step 3: Square each deviation from the mean. ... Step 4: Find the sum of squares. ... Step 5: Divide the sum of squares by n – 1 or N.
kenneth
what is error
Yakuba Reply
Is mistake done to something
Vutshila
Hy
anas
hy
What is the life teble
anas
hy
Jibrin
statistics is the analyzing of data
Tajudeen Reply
what is statics?
Zelalem Reply
how do you calculate mean
Gloria Reply
diveving the sum if all values
Shaynaynay
let A1,A2 and A3 events be independent,show that (A1)^c, (A2)^c and (A3)^c are independent?
Fisaye Reply
what is statistics
Akhisani Reply
data collected all over the world
Shaynaynay
construct a less than and more than table
Imad Reply
The sample of 16 students is taken. The average age in the sample was 22 years with astandard deviation of 6 years. Construct a 95% confidence interval for the age of the population.
Aschalew Reply
Bhartdarshan' is an internet-based travel agency wherein customer can see videos of the cities they plant to visit. The number of hits daily is a normally distributed random variable with a mean of 10,000 and a standard deviation of 2,400 a. what is the probability of getting more than 12,000 hits? b. what is the probability of getting fewer than 9,000 hits?
Akshay Reply
Bhartdarshan'is an internet-based travel agency wherein customer can see videos of the cities they plan to visit. The number of hits daily is a normally distributed random variable with a mean of 10,000 and a standard deviation of 2,400. a. What is the probability of getting more than 12,000 hits
Akshay
1
Bright
Sorry i want to learn more about this question
Bright
Someone help
Bright
a= 0.20233 b=0.3384
Sufiyan
a
Shaynaynay
How do I interpret level of significance?
Mohd Reply
It depends on your business problem or in Machine Learning you could use ROC- AUC cruve to decide the threshold value
Shivam
how skewness and kurtosis are used in statistics
Owen Reply
yes what is it
Taneeya
Got questions? Join the online conversation and get instant answers!
Jobilize.com Reply

Get Jobilize Job Search Mobile App in your pocket Now!

Get it on Google Play Download on the App Store Now


Source:  OpenStax, Psychology. OpenStax CNX. Feb 03, 2015 Download for free at https://legacy.cnx.org/content/col11629/1.5
Google Play and the Google Play logo are trademarks of Google Inc.

Notification Switch

Would you like to follow the 'Psychology' conversation and receive update notifications?

Ask