<< Chapter < Page Chapter >> Page >
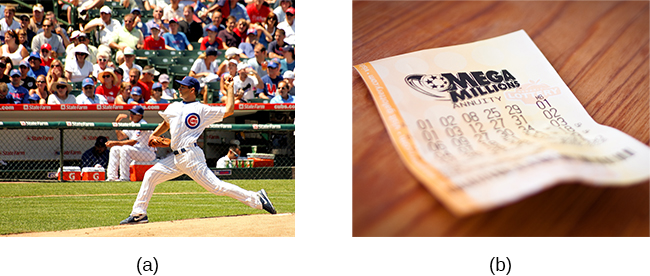
Photograph A shows a pitcher for the Cubs on the mound. Photograph B shows a lottery ticket.
(a) Long-suffering Chicago Cub fans would no doubt feel elated if their team won a World Series championship, a feat that has not been accomplished by that franchise in over a century. (b) In ways that are similar, those who play the lottery rightfully think that choosing the correct numbers and winning millions would lead to a surge in happiness. However, the initial burst of elation following such elusive events would most likely erode with time. (credit a: modification of work by Phil Roeder; credit b: modification of work by Robert S. Donovan)

Recently, some have raised questions concerning the extent to which important life events can permanently alter people’s happiness set points (Diener, Lucas,&Scollon, 2006). Evidence from a number of investigations suggests that, in some circumstances, happiness levels do not revert to their original positions. For example, although people generally tend to adapt to marriage so that it no longer makes them happier or unhappier than before, they often do not fully adapt to unemployment or severe disabilities (Diener, 2012). [link] , which is based on longitudinal data from a sample of over 3,000 German respondents, shows life satisfaction scores several years before, during, and after various life events, and it illustrates how people adapt (or fail to adapt) to these events. German respondents did not get lasting emotional boosts from marriage; instead, they reported brief increases in happiness, followed by quick adaptation. In contrast, widows and those who had been laid off experienced sizeable decreases in happiness that appeared to result in long-term changes in life satisfaction (Diener et al., 2006). Further, longitudinal data from the same sample showed that happiness levels changed significantly over time for nearly a quarter of respondents, with 9% showing major changes (Fujita&Diener, 2005). Thus, long-term happiness levels can and do change for some people.
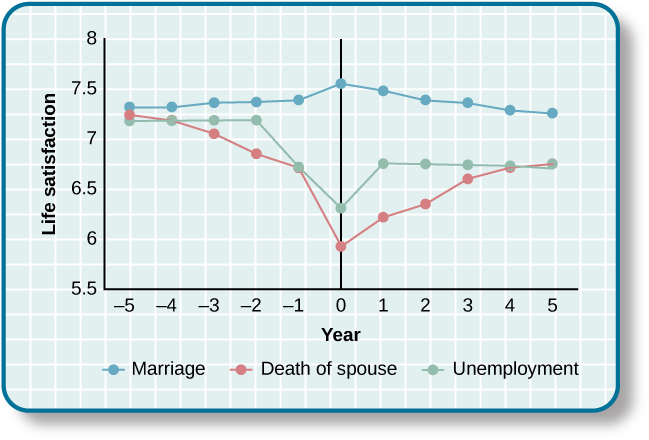
A chart compares life satisfaction scores in the years before and after significant life events. Life satisfaction is steady in the five years before and after marriage. There is a gradual incline that peaks in the year of marriage and declines slightly in the years following. With respect to unemployment, life satisfaction five years before is roughly the same as it is with marriage at that time, but begins to decline sharply around 2 years before unemployment. One year after unemployment, life satisfaction has risen slightly, but then becomes steady at a much lower level than at five years before. With respect to the death of a spouse, life satisfaction five years before is about the same as marriage at that time, but steadily declines until the death, when it starts to gradually rise again. After five years, the person who has suffered the death of a spouse has roughly the same life satisfaction as the person who was unemployed.
This graphs shows life satisfaction scores several years before and after three significant life events (0 represents the year the event happened) (Diener et al., 2006).

Increasing happiness

Some recent findings about happiness provide an optimistic picture, suggesting that real changes in happiness are possible. For example, thoughtfully developed well-being interventions designed to augment people’s baseline levels of happiness may increase happiness in ways that are permanent and long-lasting, not just temporary. These changes in happiness may be targeted at individual, organizational, and societal levels (Diener et al., 2006). Researchers in one study found that a series of happiness interventions involving such exercises as writing down three good things that occurred each day led to increases in happiness that lasted over six months (Seligman et al., 2005).

Measuring happiness    and well-being at the societal level over time may assist policy makers in determining if people are generally happy or miserable, as well as when and why they might feel the way they do. Studies show that average national happiness scores (over time and across countries) relate strongly to six key variables: per capita gross domestic product (GDP, which reflects a nation’s economic standard of living), social support, freedom to make important life choices, healthy life expectancy, freedom from perceived corruption in government and business, and generosity (Helliwell et al., 2013). Investigating why people are happy or unhappy might help policymakers develop programs that increase happiness and well-being within a society (Diener et al., 2006). Resolutions about contemporary political and social issues that are frequent topics of debate—such as poverty, taxation, affordable health care and housing, clean air and water, and income inequality—might be best considered with people’s happiness in mind.

Questions & Answers

it is the relatively stable flow of income
Chidubem Reply
what is circular flow of income
Divine Reply
branches of macroeconomics
SHEDRACK Reply
what is Flexible exchang rate?
poudel Reply
is gdp a reliable measurement of wealth
Atega Reply
introduction to econometrics
Husseini Reply
Hi
mostafa
hi
LEMLEM
hello
Sammol
hi
Mahesh
bi
Ruqayat
hi
Ruqayat
Hi fellas
Nyawa
hey
Sammol
hi
God
hello
Jahara
Good morning
Jorge
hi
abubakar
hi
Nmesoma
hi
Mahesh
Hi
Tom
Why is unemployment rate never zero at full employment?
Priyanka Reply
bcoz of existence of frictional unemployment in our economy.
Umashankar
what is flexible exchang rate?
poudel
due to existence of the pple with disabilities
Abdulraufu
the demand of a good rises, causing the demand for another good to fall
Rushawn Reply
is it possible to leave every good at the same level
Joseph
I don't think so. because check it, if the demand for chicken increases, people will no longer consume fish like they used to causing a fall in the demand for fish
Anuolu
is not really possible to let the value of a goods to be same at the same time.....
Salome
Suppose the inflation rate is 6%, does it mean that all the goods you purchase will cost 6% more than previous year? Provide with reasoning.
Geetha Reply
Not necessarily. To measure the inflation rate economists normally use an averaged price index of a basket of certain goods. So if you purchase goods included in the basket, you will notice that you pay 6% more, otherwise not necessarily.
Waeth
discus major problems of macroeconomics
Alii Reply
what is the problem of macroeconomics
Yoal
Economic growth Stable prices and low unemployment
Ephraim
explain inflationcause and itis degre
Miresa Reply
what is inflation
Getu
increase in general price levels
WEETO
Good day How do I calculate this question: C= 100+5yd G= 2000 T= 2000 I(planned)=200. Suppose the actual output is 3000. What is the level of planned expenditures at this level of output?
Chisomo Reply
how to calculate actual output?
Chisomo
how to calculate the equilibrium income
Beshir
Criteria for determining money supply
Thapase Reply
who we can define macroeconomics in one line
Muhammad
Aggregate demand
Mohammed
C=k100 +9y and i=k50.calculate the equilibrium level of output
Mercy Reply
Hi
Isiaka
Hi
Geli
hy
Man
👋
Bahunda
hy how are you?
Man
ys
Amisha
how are you guys
Sekou
f9 guys
Amisha
how are you guys
Sekou
ys am also fine
Amisha
fine and you guys
Geli
from Nepal
Amisha
nawalparasi district from belatari
Amisha
nd u
Amisha
I am Camara from Guinea west Africa... happy to meet you guys here
Sekou
ma management ho
Amisha
ahile becheclor ho
Amisha
hjr ktm bta ho ani k kaam grnu hunxa tw
Amisha
belatari
Amisha
1st year ho
Amisha
nd u
Amisha
ahh
Amisha
kaha biratnagar
Amisha
ys
Amisha
kina k vo
Amisha
money as unit of account means what?
Kalombe
A unit of account is something that can be used to value goods and services and make calculations
Jim
all of you please speak in English I can't understand you're language
Muhammad
I want to know how can we define macroeconomics in one line
Muhammad
it must be .9 or 0.9 no Mpc is greater than 1 Y=100+.9Y+50 Y-.9Y=150 0.1Y/0.1=150/0.1 Y=1500
Kalombe
Mercy is it clear?😋
Kalombe
hi can someone help me on this question If a negative shocks shifts the IS curve to the left, what type of policy do you suggest so as to stabilize the level of output? discuss your answer using appropriate graph.
Galge Reply
if interest rate is increased this will will reduce the level of income shifting the curve to the left ◀️
Kalombe
Got questions? Join the online conversation and get instant answers!
Jobilize.com Reply

Get Jobilize Job Search Mobile App in your pocket Now!

Get it on Google Play Download on the App Store Now


Source:  OpenStax, Psychology. OpenStax CNX. Feb 03, 2015 Download for free at https://legacy.cnx.org/content/col11629/1.5
Google Play and the Google Play logo are trademarks of Google Inc.

Notification Switch

Would you like to follow the 'Psychology' conversation and receive update notifications?

Ask