<< Chapter < Page Chapter >> Page >
Photograph A shows a pitcher for the Cubs on the mound. Photograph B shows a lottery ticket.
(a) Long-suffering Chicago Cub fans would no doubt feel elated if their team won a World Series championship, a feat that has not been accomplished by that franchise in over a century. (b) In ways that are similar, those who play the lottery rightfully think that choosing the correct numbers and winning millions would lead to a surge in happiness. However, the initial burst of elation following such elusive events would most likely erode with time. (credit a: modification of work by Phil Roeder; credit b: modification of work by Robert S. Donovan)

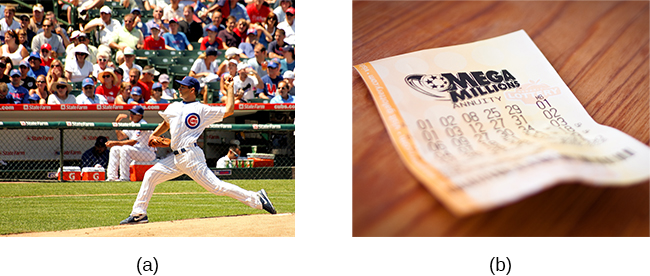
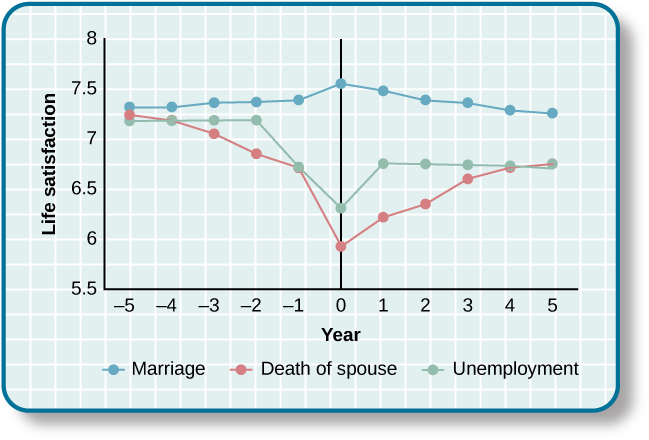
Recently, some have raised questions concerning the extent to which important life events can permanently alter people’s happiness set points (Diener, Lucas,&Scollon, 2006). Evidence from a number of investigations suggests that, in some circumstances, happiness levels do not revert to their original positions. For example, although people generally tend to adapt to marriage so that it no longer makes them happier or unhappier than before, they often do not fully adapt to unemployment or severe disabilities (Diener, 2012). [link] , which is based on longitudinal data from a sample of over 3,000 German respondents, shows life satisfaction scores several years before, during, and after various life events, and it illustrates how people adapt (or fail to adapt) to these events. German respondents did not get lasting emotional boosts from marriage; instead, they reported brief increases in happiness, followed by quick adaptation. In contrast, widows and those who had been laid off experienced sizeable decreases in happiness that appeared to result in long-term changes in life satisfaction (Diener et al., 2006). Further, longitudinal data from the same sample showed that happiness levels changed significantly over time for nearly a quarter of respondents, with 9% showing major changes (Fujita&Diener, 2005). Thus, long-term happiness levels can and do change for some people.

A chart compares life satisfaction scores in the years before and after significant life events. Life satisfaction is steady in the five years before and after marriage. There is a gradual incline that peaks in the year of marriage and declines slightly in the years following. With respect to unemployment, life satisfaction five years before is roughly the same as it is with marriage at that time, but begins to decline sharply around 2 years before unemployment. One year after unemployment, life satisfaction has risen slightly, but then becomes steady at a much lower level than at five years before. With respect to the death of a spouse, life satisfaction five years before is about the same as marriage at that time, but steadily declines until the death, when it starts to gradually rise again. After five years, the person who has suffered the death of a spouse has roughly the same life satisfaction as the person who was unemployed.
This graphs shows life satisfaction scores several years before and after three significant life events (0 represents the year the event happened) (Diener et al., 2006).

Increasing happiness

Some recent findings about happiness provide an optimistic picture, suggesting that real changes in happiness are possible. For example, thoughtfully developed well-being interventions designed to augment people’s baseline levels of happiness may increase happiness in ways that are permanent and long-lasting, not just temporary. These changes in happiness may be targeted at individual, organizational, and societal levels (Diener et al., 2006). Researchers in one study found that a series of happiness interventions involving such exercises as writing down three good things that occurred each day led to increases in happiness that lasted over six months (Seligman et al., 2005).

Measuring happiness    and well-being at the societal level over time may assist policy makers in determining if people are generally happy or miserable, as well as when and why they might feel the way they do. Studies show that average national happiness scores (over time and across countries) relate strongly to six key variables: per capita gross domestic product (GDP, which reflects a nation’s economic standard of living), social support, freedom to make important life choices, healthy life expectancy, freedom from perceived corruption in government and business, and generosity (Helliwell et al., 2013). Investigating why people are happy or unhappy might help policymakers develop programs that increase happiness and well-being within a society (Diener et al., 2006). Resolutions about contemporary political and social issues that are frequent topics of debate—such as poverty, taxation, affordable health care and housing, clean air and water, and income inequality—might be best considered with people’s happiness in mind.

Questions & Answers

What are the factors that affect demand for a commodity
Florence Reply
differentiate between demand and supply giving examples
Lambiv Reply
differentiated between demand and supply using examples
Lambiv
what is labour ?
Lambiv
how will I do?
Venny Reply
how is the graph works?I don't fully understand
Rezat Reply
information
Eliyee
devaluation
Eliyee
t
WARKISA
hi guys good evening to all
Lambiv
multiple choice question
Aster Reply
appreciation
Eliyee
explain perfect market
Lindiwe Reply
In economics, a perfect market refers to a theoretical construct where all participants have perfect information, goods are homogenous, there are no barriers to entry or exit, and prices are determined solely by supply and demand. It's an idealized model used for analysis,
Ezea
What is ceteris paribus?
Shukri Reply
other things being equal
AI-Robot
When MP₁ becomes negative, TP start to decline. Extuples Suppose that the short-run production function of certain cut-flower firm is given by: Q=4KL-0.6K2 - 0.112 • Where is quantity of cut flower produced, I is labour input and K is fixed capital input (K-5). Determine the average product of lab
Kelo
Extuples Suppose that the short-run production function of certain cut-flower firm is given by: Q=4KL-0.6K2 - 0.112 • Where is quantity of cut flower produced, I is labour input and K is fixed capital input (K-5). Determine the average product of labour (APL) and marginal product of labour (MPL)
Kelo
yes,thank you
Shukri
Can I ask you other question?
Shukri
what is monopoly mean?
Habtamu Reply
What is different between quantity demand and demand?
Shukri Reply
Quantity demanded refers to the specific amount of a good or service that consumers are willing and able to purchase at a give price and within a specific time period. Demand, on the other hand, is a broader concept that encompasses the entire relationship between price and quantity demanded
Ezea
ok
Shukri
how do you save a country economic situation when it's falling apart
Lilia Reply
what is the difference between economic growth and development
Fiker Reply
Economic growth as an increase in the production and consumption of goods and services within an economy.but Economic development as a broader concept that encompasses not only economic growth but also social & human well being.
Shukri
production function means
Jabir
What do you think is more important to focus on when considering inequality ?
Abdisa Reply
any question about economics?
Awais Reply
sir...I just want to ask one question... Define the term contract curve? if you are free please help me to find this answer 🙏
Asui
it is a curve that we get after connecting the pareto optimal combinations of two consumers after their mutually beneficial trade offs
Awais
thank you so much 👍 sir
Asui
In economics, the contract curve refers to the set of points in an Edgeworth box diagram where both parties involved in a trade cannot be made better off without making one of them worse off. It represents the Pareto efficient allocations of goods between two individuals or entities, where neither p
Cornelius
In economics, the contract curve refers to the set of points in an Edgeworth box diagram where both parties involved in a trade cannot be made better off without making one of them worse off. It represents the Pareto efficient allocations of goods between two individuals or entities,
Cornelius
Suppose a consumer consuming two commodities X and Y has The following utility function u=X0.4 Y0.6. If the price of the X and Y are 2 and 3 respectively and income Constraint is birr 50. A,Calculate quantities of x and y which maximize utility. B,Calculate value of Lagrange multiplier. C,Calculate quantities of X and Y consumed with a given price. D,alculate optimum level of output .
Feyisa Reply
Answer
Feyisa
c
Jabir
the market for lemon has 10 potential consumers, each having an individual demand curve p=101-10Qi, where p is price in dollar's per cup and Qi is the number of cups demanded per week by the i th consumer.Find the market demand curve using algebra. Draw an individual demand curve and the market dema
Gsbwnw Reply
suppose the production function is given by ( L, K)=L¼K¾.assuming capital is fixed find APL and MPL. consider the following short run production function:Q=6L²-0.4L³ a) find the value of L that maximizes output b)find the value of L that maximizes marginal product
Abdureman
Got questions? Join the online conversation and get instant answers!
Jobilize.com Reply

Get Jobilize Job Search Mobile App in your pocket Now!

Get it on Google Play Download on the App Store Now


Source:  OpenStax, Psychology. OpenStax CNX. Feb 03, 2015 Download for free at https://legacy.cnx.org/content/col11629/1.5
Google Play and the Google Play logo are trademarks of Google Inc.

Notification Switch

Would you like to follow the 'Psychology' conversation and receive update notifications?

Ask