

| << Chapter < Page | Chapter >> Page > |
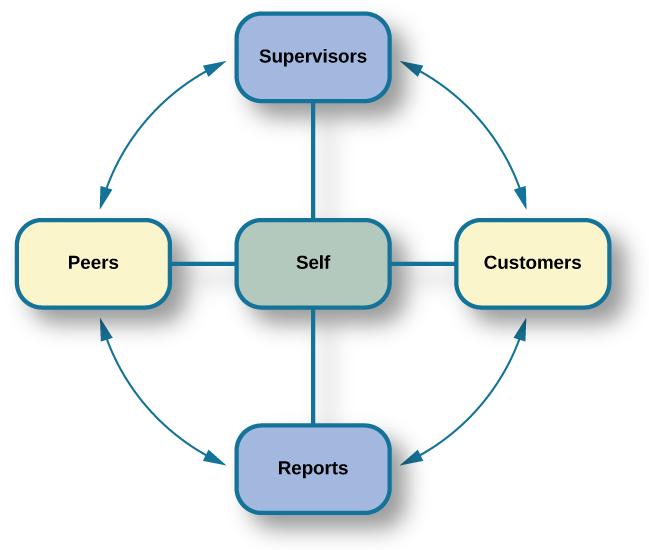
Few studies have assessed the effectiveness of 360-degree methods, but Atkins and Wood (2002) found that the self and peer ratings were unreliable as an assessment of an employee’s performance and that even supervisors tended to underrate employees that gave themselves modest feedback ratings. However, a different perspective sees this variability in ratings as a positive in that it provides for greater learning on the part of the employees as they and their supervisor discuss the reasons for the discrepancies (Tornow, 1993b).
In theory, performance appraisals should be an asset for an organization wishing to achieve its goals, and most employees will actually solicit feedback regarding their jobs if it is not offered (DeNisi&Kluger, 2000). However, in practice, many performance evaluations are disliked by organizations, employees, or both (Fletcher, 2001), and few of them have been adequately tested to see if they do in fact improve performance or motivate employees (DeNisi&Kluger, 2000). One of the reasons evaluations fail to accomplish their purpose in an organization is that performance appraisal systems are often used incorrectly or are of an inappropriate type for an organization’s particular culture (Schraeder, Becton,&Portis, 2007). An organization’s culture is how the organization is run, how it operates, and how it makes decisions. It is based on the collective values, hierarchies, and how individuals within the organization interact. Examining the effectiveness of performance appraisal systems in particular organizations and the effectiveness of training for the implementation of the performance appraisal system is an active area of research in industrial psychology (Fletcher, 2001).
In an ideal hiring process, an organization would generate a job analysis that accurately reflects the requirements of the position, and it would accurately assess candidates’ KSAs to determine who the best individual is to carry out the job’s requirements. For many reasons, hiring decisions in the real world are often made based on factors other than matching a job analysis to KSAs. As mentioned earlier, interview rankings can be influenced by other factors: similarity to the interviewer (Bye, Horverak, Sandal, Sam,&Vijver, 2014) and the regional accent of the interviewee (Rakić, Steffens,&Mummendey 2011). A study by Agerström&Rooth (2011) examined hiring managers’ decisions to invite equally qualified normal-weight and obese job applicants to an interview. The decisions of the hiring managers were based on photographs of the two applicants. The study found that hiring managers that scored high on a test of negative associations with overweight people displayed a bias in favor of inviting the equally qualified normal-weight applicant but not inviting the obese applicant. The association test measures automatic or subconscious associations between an individual’s negative or positive values and, in this case, the body-weight attribute. A meta-analysis of experimental studies found that physical attractiveness benefited individuals in various job-related outcomes such as hiring, promotion, and performance review (Hosoda, Stone-Romero,&Coats, 2003). They also found that the strength of the benefit appeared to be decreasing with time between the late 1970s and the late 1990s.
Notification Switch
Would you like to follow the 'Psychology' conversation and receive update notifications?

|
|
|
|
|

|
|

|
|

|
|

|
|

|
|

|
|

|
|

|
|

|
|

|