<< Chapter < Page Chapter >> Page >
By the end of this section, you will be able to:
  • Describe important physical features of wave forms
  • Show how physical properties of light waves are associated with perceptual experience
  • Show how physical properties of sound waves are associated with perceptual experience

Visual and auditory stimuli both occur in the form of waves. Although the two stimuli are very different in terms of composition, wave forms share similar characteristics that are especially important to our visual and auditory perceptions. In this section, we describe the physical properties of the waves as well as the perceptual experiences associated with them.

Amplitude and wavelength

Two physical characteristics of a wave are amplitude and wavelength ( [link] ). The amplitude    of a wave is the height of a wave as measured from the highest point on the wave ( peak    or crest ) to the lowest point on the wave ( trough    ). Wavelength refers to the length of a wave from one peak to the next.

A diagram illustrates the basic parts of a wave. Moving from left to right, the wavelength line begins above a straight horizontal line and falls and rises equally above and below that line. One of the areas where the wavelength line reaches its highest point is labeled “Peak.” A horizontal bracket, labeled “Wavelength,” extends from this area to the next peak. One of the areas where the wavelength reaches its lowest point is labeled “Trough.” A vertical bracket, labeled “Amplitude,” extends from a “Peak” to a “Trough.”
The amplitude or height of a wave is measured from the peak to the trough. The wavelength is measured from peak to peak.

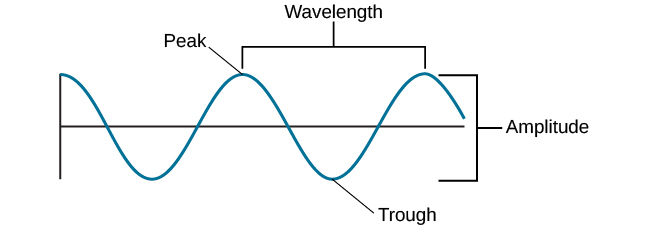
Wavelength is directly related to the frequency of a given wave form. Frequency refers to the number of waves that pass a given point in a given time period and is often expressed in terms of hertz (Hz)    , or cycles per second. Longer wavelengths will have lower frequencies, and shorter wavelengths will have higher frequencies ( [link] ).

Stacked vertically are 5 waves of different colors and wavelengths. The top wave is red with a long wavelengths, which indicate a low frequency. Moving downward, the color of each wave is different: orange, yellow, green, and blue. Also moving downward, the wavelengths become shorter as the frequencies increase.
This figure illustrates waves of differing wavelengths/frequencies. At the top of the figure, the red wave has a long wavelength/short frequency. Moving from top to bottom, the wavelengths decrease and frequencies increase.

Light waves

The visible spectrum    is the portion of the larger electromagnetic spectrum    that we can see. As [link] shows, the electromagnetic spectrum encompasses all of the electromagnetic radiation that occurs in our environment and includes gamma rays, x-rays, ultraviolet light, visible light, infrared light, microwaves, and radio waves. The visible spectrum in humans is associated with wavelengths that range from 380 to 740 nm—a very small distance, since a nanometer (nm) is one billionth of a meter. Other species can detect other portions of the electromagnetic spectrum. For instance, honeybees can see light in the ultraviolet range (Wakakuwa, Stavenga,&Arikawa, 2007), and some snakes can detect infrared radiation in addition to more traditional visual light cues (Chen, Deng, Brauth, Ding,&Tang, 2012; Hartline, Kass,&Loop, 1978).

This illustration shows the wavelength, frequency, and size of objects across the electromagnetic spectrum.. At the top, various wavelengths are given in sequence from small to large, with a parallel illustration of a wave with increasing frequency. These are the provided wavelengths, measured in meters: “Gamma ray 10 to the negative twelfth power,” “x-ray 10 to the negative tenth power,” ultraviolet 10 to the negative eighth power,” “visible .5 times 10 to the negative sixth power,” “infrared 10 to the negative fifth power,” microwave 10 to the negative second power,” and “radio 10 cubed.”Another section is labeled “About the size of” and lists from left to right: “Atomic nuclei,” “Atoms,” “Molecules,” “Protozoans,” “Pinpoints,” “Honeybees,” “Humans,” and “Buildings” with an illustration of each . At the bottom is a line labeled “Frequency” with the following measurements in hertz: 10 to the powers of 20, 18, 16, 15, 12, 8, and 4. From left to right the line changes in color from purple to red with the remaining colors of the visible spectrum in between.
Light that is visible to humans makes up only a small portion of the electromagnetic spectrum.

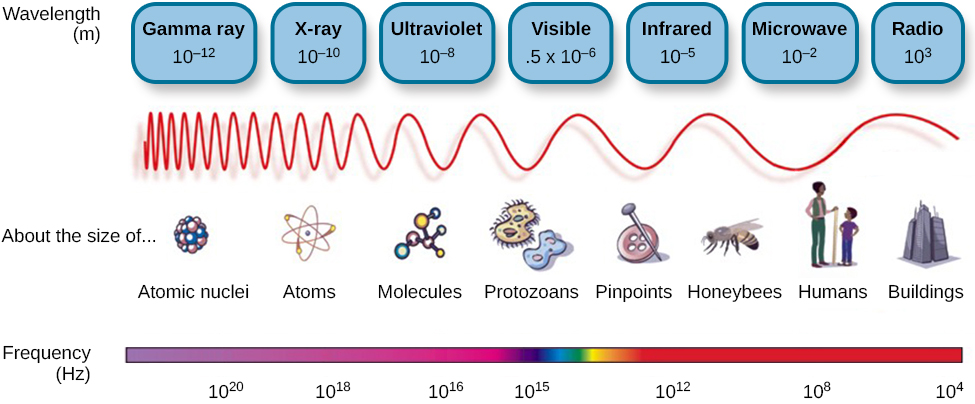
In humans, light wavelength is associated with perception of color ( [link] ). Within the visible spectrum, our experience of red is associated with longer wavelengths, greens are intermediate, and blues and violets are shorter in wavelength. (An easy way to remember this is the mnemonic ROYGBIV: r ed, o range, y ellow, g reen, b lue, i ndigo, v iolet.) The amplitude of light waves is associated with our experience of brightness or intensity of color, with larger amplitudes appearing brighter.

Questions & Answers

it is the relatively stable flow of income
Chidubem Reply
what is circular flow of income
Divine Reply
branches of macroeconomics
SHEDRACK Reply
what is Flexible exchang rate?
poudel Reply
is gdp a reliable measurement of wealth
Atega Reply
introduction to econometrics
Husseini Reply
Hi
mostafa
hi
LEMLEM
hello
Sammol
hi
Mahesh
bi
Ruqayat
hi
Ruqayat
Hi fellas
Nyawa
hey
Sammol
hi
God
hello
Jahara
Good morning
Jorge
hi
abubakar
hi
Nmesoma
hi
Mahesh
Hi
Tom
Why is unemployment rate never zero at full employment?
Priyanka Reply
bcoz of existence of frictional unemployment in our economy.
Umashankar
what is flexible exchang rate?
poudel
due to existence of the pple with disabilities
Abdulraufu
the demand of a good rises, causing the demand for another good to fall
Rushawn Reply
is it possible to leave every good at the same level
Joseph
I don't think so. because check it, if the demand for chicken increases, people will no longer consume fish like they used to causing a fall in the demand for fish
Anuolu
is not really possible to let the value of a goods to be same at the same time.....
Salome
Suppose the inflation rate is 6%, does it mean that all the goods you purchase will cost 6% more than previous year? Provide with reasoning.
Geetha Reply
Not necessarily. To measure the inflation rate economists normally use an averaged price index of a basket of certain goods. So if you purchase goods included in the basket, you will notice that you pay 6% more, otherwise not necessarily.
Waeth
discus major problems of macroeconomics
Alii Reply
what is the problem of macroeconomics
Yoal
Economic growth Stable prices and low unemployment
Ephraim
explain inflationcause and itis degre
Miresa Reply
what is inflation
Getu
increase in general price levels
WEETO
Good day How do I calculate this question: C= 100+5yd G= 2000 T= 2000 I(planned)=200. Suppose the actual output is 3000. What is the level of planned expenditures at this level of output?
Chisomo Reply
how to calculate actual output?
Chisomo
how to calculate the equilibrium income
Beshir
Criteria for determining money supply
Thapase Reply
who we can define macroeconomics in one line
Muhammad
Aggregate demand
Mohammed
C=k100 +9y and i=k50.calculate the equilibrium level of output
Mercy Reply
Hi
Isiaka
Hi
Geli
hy
Man
👋
Bahunda
hy how are you?
Man
ys
Amisha
how are you guys
Sekou
f9 guys
Amisha
how are you guys
Sekou
ys am also fine
Amisha
fine and you guys
Geli
from Nepal
Amisha
nawalparasi district from belatari
Amisha
nd u
Amisha
I am Camara from Guinea west Africa... happy to meet you guys here
Sekou
ma management ho
Amisha
ahile becheclor ho
Amisha
hjr ktm bta ho ani k kaam grnu hunxa tw
Amisha
belatari
Amisha
1st year ho
Amisha
nd u
Amisha
ahh
Amisha
kaha biratnagar
Amisha
ys
Amisha
kina k vo
Amisha
money as unit of account means what?
Kalombe
A unit of account is something that can be used to value goods and services and make calculations
Jim
all of you please speak in English I can't understand you're language
Muhammad
I want to know how can we define macroeconomics in one line
Muhammad
it must be .9 or 0.9 no Mpc is greater than 1 Y=100+.9Y+50 Y-.9Y=150 0.1Y/0.1=150/0.1 Y=1500
Kalombe
Mercy is it clear?😋
Kalombe
hi can someone help me on this question If a negative shocks shifts the IS curve to the left, what type of policy do you suggest so as to stabilize the level of output? discuss your answer using appropriate graph.
Galge Reply
if interest rate is increased this will will reduce the level of income shifting the curve to the left ◀️
Kalombe
Got questions? Join the online conversation and get instant answers!
Jobilize.com Reply

Get Jobilize Job Search Mobile App in your pocket Now!

Get it on Google Play Download on the App Store Now


Source:  OpenStax, Psychology. OpenStax CNX. Feb 03, 2015 Download for free at https://legacy.cnx.org/content/col11629/1.5
Google Play and the Google Play logo are trademarks of Google Inc.

Notification Switch

Would you like to follow the 'Psychology' conversation and receive update notifications?

Ask