<< Chapter < Page Chapter >> Page >
By the end of this section, you will be able to:
  • Describe how genetics and environment affect intelligence
  • Explain the relationship between IQ scores and socioeconomic status
  • Describe the difference between a learning disability and a developmental disorder

A young girl, born of teenage parents, lives with her grandmother in rural Mississippi. They are poor—in serious poverty—but they do their best to get by with what they have. She learns to read when she is just 3 years old. As she grows older, she longs to live with her mother, who now resides in Wisconsin. She moves there at the age of 6 years. At 9 years of age, she is raped. During the next several years, several different male relatives repeatedly molest her. Her life unravels. She turns to drugs and sex to fill the deep, lonely void inside her. Her mother then sends her to Nashville to live with her father, who imposes strict behavioral expectations upon her, and over time, her wild life settles once again. She begins to experience success in school, and at 19 years old, becomes the youngest and first African-American female news anchor (“Dates and Events,” n.d.). The woman—Oprah Winfrey—goes on to become a media giant known for both her intelligence and her empathy.

High intelligence: nature or nurture?

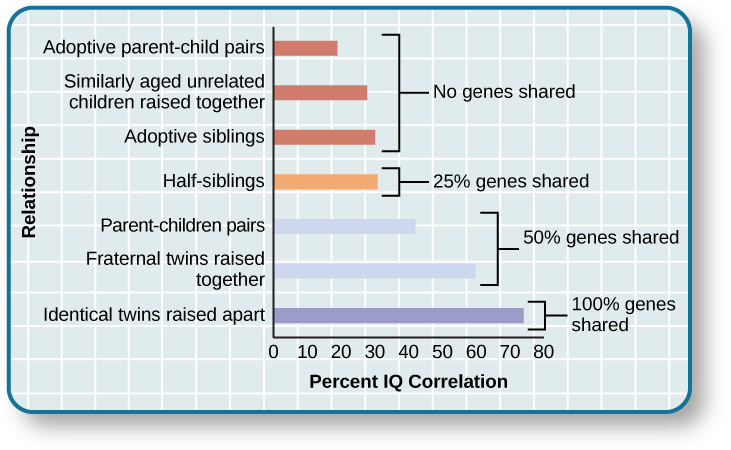
Where does high intelligence come from? Some researchers believe that intelligence is a trait inherited from a person’s parents. Scientists who research this topic typically use twin studies to determine the heritability of intelligence. The Minnesota Study of Twins Reared Apart is one of the most well-known twin studies. In this investigation, researchers found that identical twins raised together and identical twins raised apart exhibit a higher correlation between their IQ scores than siblings or fraternal twins raised together (Bouchard, Lykken, McGue, Segal,&Tellegen, 1990). The findings from this study reveal a genetic component to intelligence ( [link] ). At the same time, other psychologists believe that intelligence is shaped by a child’s developmental environment. If parents were to provide their children with intellectual stimuli from before they are born, it is likely that they would absorb the benefits of that stimulation, and it would be reflected in intelligence levels.

A chart shows correlations of IQs for people of varying relationships. The bottom is labeled “Percent IQ Correlation” and the left side is labeled “Relationship.” The percent IQ Correlation for relationships where no genes are shared, including adoptive parent-child pairs, similarly aged unrelated children raised together, and adoptive siblings are around 21 percent, 30 percent, and 32 percent, respectively. The percent IQ Correlation for relationships where 25 percent of genes are shared, as in half-siblings, is around 33 percent. The percent IQ Correlation for relationships where 50 percent of genes are shared, including parent-children pairs, and fraternal twins raised together, are roughly 44 percent and 62 percent, respectively. A relationship where 100 percent of genes are shared, as in identical twins raised apart, results in a nearly 80 percent IQ correlation.
The correlations of IQs of unrelated versus related persons reared apart or together suggest a genetic component to intelligence.

The reality is that aspects of each idea are probably correct. In fact, one study suggests that although genetics seem to be in control of the level of intelligence, the environmental influences provide both stability and change to trigger manifestation of cognitive abilities (Bartels, Rietveld, Van Baal,&Boomsma, 2002). Certainly, there are behaviors that support the development of intelligence, but the genetic component of high intelligence should not be ignored. As with all heritable traits, however, it is not always possible to isolate how and when high intelligence is passed on to the next generation.

Questions & Answers

how do you get the 2/50
Abba Reply
number of sport play by 50 student construct discrete data
Aminu Reply
width of the frangebany leaves on how to write a introduction
Theresa Reply
Solve the mean of variance
Veronica Reply
Step 1: Find the mean. To find the mean, add up all the scores, then divide them by the number of scores. ... Step 2: Find each score's deviation from the mean. ... Step 3: Square each deviation from the mean. ... Step 4: Find the sum of squares. ... Step 5: Divide the sum of squares by n – 1 or N.
kenneth
what is error
Yakuba Reply
Is mistake done to something
Vutshila
Hy
anas
hy
What is the life teble
anas
hy
Jibrin
statistics is the analyzing of data
Tajudeen Reply
what is statics?
Zelalem Reply
how do you calculate mean
Gloria Reply
diveving the sum if all values
Shaynaynay
let A1,A2 and A3 events be independent,show that (A1)^c, (A2)^c and (A3)^c are independent?
Fisaye Reply
what is statistics
Akhisani Reply
data collected all over the world
Shaynaynay
construct a less than and more than table
Imad Reply
The sample of 16 students is taken. The average age in the sample was 22 years with astandard deviation of 6 years. Construct a 95% confidence interval for the age of the population.
Aschalew Reply
Bhartdarshan' is an internet-based travel agency wherein customer can see videos of the cities they plant to visit. The number of hits daily is a normally distributed random variable with a mean of 10,000 and a standard deviation of 2,400 a. what is the probability of getting more than 12,000 hits? b. what is the probability of getting fewer than 9,000 hits?
Akshay Reply
Bhartdarshan'is an internet-based travel agency wherein customer can see videos of the cities they plan to visit. The number of hits daily is a normally distributed random variable with a mean of 10,000 and a standard deviation of 2,400. a. What is the probability of getting more than 12,000 hits
Akshay
1
Bright
Sorry i want to learn more about this question
Bright
Someone help
Bright
a= 0.20233 b=0.3384
Sufiyan
a
Shaynaynay
How do I interpret level of significance?
Mohd Reply
It depends on your business problem or in Machine Learning you could use ROC- AUC cruve to decide the threshold value
Shivam
how skewness and kurtosis are used in statistics
Owen Reply
yes what is it
Taneeya
Got questions? Join the online conversation and get instant answers!
Jobilize.com Reply

Get Jobilize Job Search Mobile App in your pocket Now!

Get it on Google Play Download on the App Store Now


Source:  OpenStax, Psychology. OpenStax CNX. Feb 03, 2015 Download for free at https://legacy.cnx.org/content/col11629/1.5
Google Play and the Google Play logo are trademarks of Google Inc.

Notification Switch

Would you like to follow the 'Psychology' conversation and receive update notifications?

Ask