<< Chapter < Page Chapter >> Page >
By the end of this section, you will be able to:
  • Describe important physical features of wave forms
  • Show how physical properties of light waves are associated with perceptual experience
  • Show how physical properties of sound waves are associated with perceptual experience

Visual and auditory stimuli both occur in the form of waves. Although the two stimuli are very different in terms of composition, wave forms share similar characteristics that are especially important to our visual and auditory perceptions. In this section, we describe the physical properties of the waves as well as the perceptual experiences associated with them.

Amplitude and wavelength

Two physical characteristics of a wave are amplitude and wavelength ( [link] ). The amplitude    of a wave is the height of a wave as measured from the highest point on the wave ( peak    or crest ) to the lowest point on the wave ( trough    ). Wavelength refers to the length of a wave from one peak to the next.
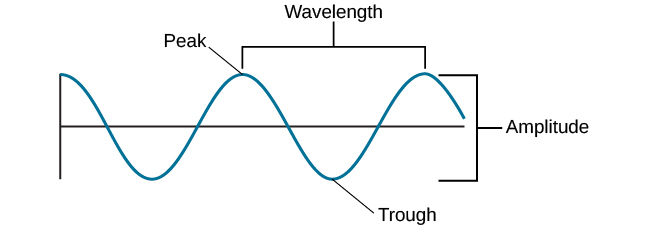
A diagram illustrates the basic parts of a wave. Moving from left to right, the wavelength line begins above a straight horizontal line and falls and rises equally above and below that line. One of the areas where the wavelength line reaches its highest point is labeled “Peak.” A horizontal bracket, labeled “Wavelength,” extends from this area to the next peak. One of the areas where the wavelength reaches its lowest point is labeled “Trough.” A vertical bracket, labeled “Amplitude,” extends from a “Peak” to a “Trough.”
The amplitude or height of a wave is measured from the peak to the trough. The wavelength is measured from peak to peak.

Wavelength is directly related to the frequency of a given wave form. Frequency refers to the number of waves that pass a given point in a given time period and is often expressed in terms of hertz (Hz)    , or cycles per second. Longer wavelengths will have lower frequencies, and shorter wavelengths will have higher frequencies ( [link] ).

Stacked vertically are 5 waves of different colors and wavelengths. The top wave is red with a long wavelengths, which indicate a low frequency. Moving downward, the color of each wave is different: orange, yellow, green, and blue. Also moving downward, the wavelengths become shorter as the frequencies increase.
This figure illustrates waves of differing wavelengths/frequencies. At the top of the figure, the red wave has a long wavelength/short frequency. Moving from top to bottom, the wavelengths decrease and frequencies increase.

Light waves

The visible spectrum    is the portion of the larger electromagnetic spectrum    that we can see. As [link] shows, the electromagnetic spectrum encompasses all of the electromagnetic radiation that occurs in our environment and includes gamma rays, x-rays, ultraviolet light, visible light, infrared light, microwaves, and radio waves. The visible spectrum in humans is associated with wavelengths that range from 380 to 740 nm—a very small distance, since a nanometer (nm) is one billionth of a meter. Other species can detect other portions of the electromagnetic spectrum. For instance, honeybees can see light in the ultraviolet range (Wakakuwa, Stavenga,&Arikawa, 2007), and some snakes can detect infrared radiation in addition to more traditional visual light cues (Chen, Deng, Brauth, Ding,&Tang, 2012; Hartline, Kass,&Loop, 1978).
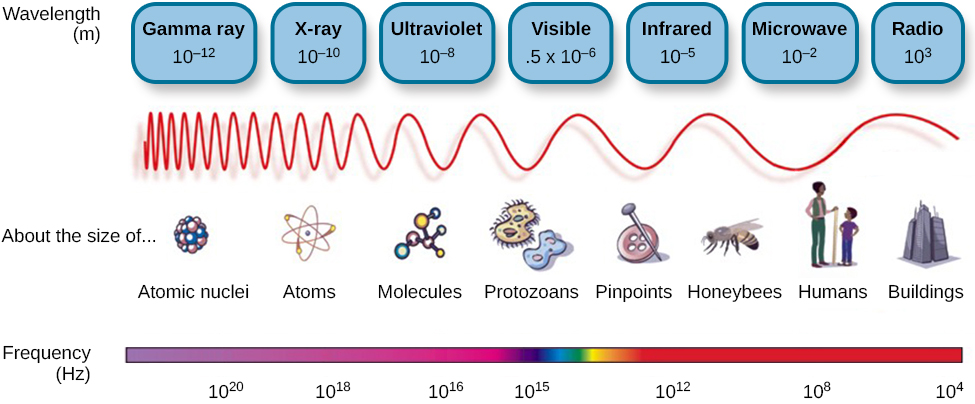
This illustration shows the wavelength, frequency, and size of objects across the electromagnetic spectrum.. At the top, various wavelengths are given in sequence from small to large, with a parallel illustration of a wave with increasing frequency. These are the provided wavelengths, measured in meters: “Gamma ray 10 to the negative twelfth power,” “x-ray 10 to the negative tenth power,” ultraviolet 10 to the negative eighth power,” “visible .5 times 10 to the negative sixth power,” “infrared 10 to the negative fifth power,” microwave 10 to the negative second power,” and “radio 10 cubed.”Another section is labeled “About the size of” and lists from left to right: “Atomic nuclei,” “Atoms,” “Molecules,” “Protozoans,” “Pinpoints,” “Honeybees,” “Humans,” and “Buildings” with an illustration of each . At the bottom is a line labeled “Frequency” with the following measurements in hertz: 10 to the powers of 20, 18, 16, 15, 12, 8, and 4. From left to right the line changes in color from purple to red with the remaining colors of the visible spectrum in between.
Light that is visible to humans makes up only a small portion of the electromagnetic spectrum.

In humans, light wavelength is associated with perception of color ( [link] ). Within the visible spectrum, our experience of red is associated with longer wavelengths, greens are intermediate, and blues and violets are shorter in wavelength. (An easy way to remember this is the mnemonic ROYGBIV: r ed, o range, y ellow, g reen, b lue, i ndigo, v iolet.) The amplitude of light waves is associated with our experience of brightness or intensity of color, with larger amplitudes appearing brighter.

Questions & Answers

how do you get the 2/50
Abba Reply
number of sport play by 50 student construct discrete data
Aminu Reply
width of the frangebany leaves on how to write a introduction
Theresa Reply
Solve the mean of variance
Veronica Reply
Step 1: Find the mean. To find the mean, add up all the scores, then divide them by the number of scores. ... Step 2: Find each score's deviation from the mean. ... Step 3: Square each deviation from the mean. ... Step 4: Find the sum of squares. ... Step 5: Divide the sum of squares by n – 1 or N.
kenneth
what is error
Yakuba Reply
Is mistake done to something
Vutshila
Hy
anas
hy
What is the life teble
anas
hy
Jibrin
statistics is the analyzing of data
Tajudeen Reply
what is statics?
Zelalem Reply
how do you calculate mean
Gloria Reply
diveving the sum if all values
Shaynaynay
let A1,A2 and A3 events be independent,show that (A1)^c, (A2)^c and (A3)^c are independent?
Fisaye Reply
what is statistics
Akhisani Reply
data collected all over the world
Shaynaynay
construct a less than and more than table
Imad Reply
The sample of 16 students is taken. The average age in the sample was 22 years with astandard deviation of 6 years. Construct a 95% confidence interval for the age of the population.
Aschalew Reply
Bhartdarshan' is an internet-based travel agency wherein customer can see videos of the cities they plant to visit. The number of hits daily is a normally distributed random variable with a mean of 10,000 and a standard deviation of 2,400 a. what is the probability of getting more than 12,000 hits? b. what is the probability of getting fewer than 9,000 hits?
Akshay Reply
Bhartdarshan'is an internet-based travel agency wherein customer can see videos of the cities they plan to visit. The number of hits daily is a normally distributed random variable with a mean of 10,000 and a standard deviation of 2,400. a. What is the probability of getting more than 12,000 hits
Akshay
1
Bright
Sorry i want to learn more about this question
Bright
Someone help
Bright
a= 0.20233 b=0.3384
Sufiyan
a
Shaynaynay
How do I interpret level of significance?
Mohd Reply
It depends on your business problem or in Machine Learning you could use ROC- AUC cruve to decide the threshold value
Shivam
how skewness and kurtosis are used in statistics
Owen Reply
yes what is it
Taneeya
Got questions? Join the online conversation and get instant answers!
Jobilize.com Reply

Get Jobilize Job Search Mobile App in your pocket Now!

Get it on Google Play Download on the App Store Now


Source:  OpenStax, Psychology. OpenStax CNX. Feb 03, 2015 Download for free at https://legacy.cnx.org/content/col11629/1.5
Google Play and the Google Play logo are trademarks of Google Inc.

Notification Switch

Would you like to follow the 'Psychology' conversation and receive update notifications?

Ask