Now that we have analyzed the equations for rational functions and how they relate to a graph of the function, we can use information given by a graph to write the function. A rational function written in factored form will have an
x -intercept where each factor of the numerator is equal to zero. (An exception occurs in the case of a removable discontinuity.) As a result, we can form a numerator of a function whose graph will pass through a set of
x -intercepts by introducing a corresponding set of factors. Likewise, because the function will have a vertical asymptote where each factor of the denominator is equal to zero, we can form a denominator that will produce the vertical asymptotes by introducing a corresponding set of factors.
Writing rational functions from intercepts and asymptotes
If a
rational function has
x -intercepts at
vertical asymptotes at
and no
then the function can be written in the form:
where the powers
or
on each factor can be determined by the behavior of the graph at the corresponding intercept or asymptote, and the stretch factor
can be determined given a value of the function other than the
x -intercept or by the horizontal asymptote if it is nonzero.
Given a graph of a rational function, write the function.
Determine the factors of the numerator. Examine the behavior of the graph at the
x -intercepts to determine the zeroes and their multiplicities. (This is easy to do when finding the “simplest” function with small multiplicities—such as 1 or 3—but may be difficult for larger multiplicities—such as 5 or 7, for example.)
Determine the factors of the denominator. Examine the behavior on both sides of each vertical asymptote to determine the factors and their powers.
Use any clear point on the graph to find the stretch factor.
Writing a rational function from intercepts and asymptotes
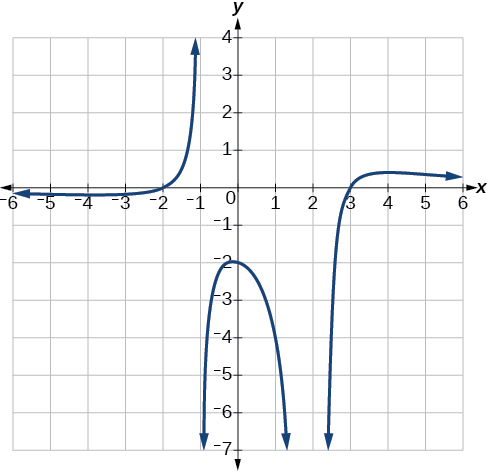
Write an equation for the rational function shown in
[link] .
The graph appears to have
x -intercepts at
and
At both, the graph passes through the intercept, suggesting linear factors. The graph has two vertical asymptotes. The one at
seems to exhibit the basic behavior similar to
with the graph heading toward positive infinity on one side and heading toward negative infinity on the other. The asymptote at
is exhibiting a behavior similar to
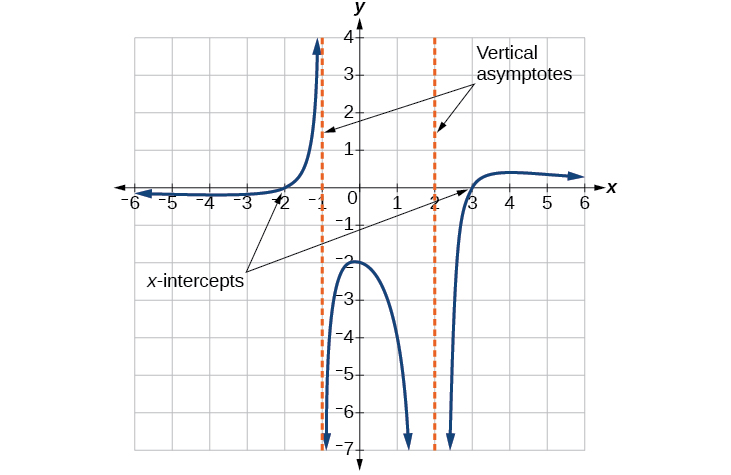
with the graph heading toward negative infinity on both sides of the asymptote. See
[link] .
We can use this information to write a function of the form
To find the stretch factor, we can use another clear point on the graph, such as the
y -intercept
is it possible to leave every good at the same level
Joseph
I don't think so. because check it, if the demand for chicken increases, people will no longer consume fish like they used to causing a fall in the demand for fish
Anuolu
is not really possible to let the value of a goods to be same at the same time.....
Salome
Suppose the inflation rate is 6%, does it mean that all the goods you purchase will cost
6% more than previous year? Provide with reasoning.
Not necessarily. To measure the inflation rate economists normally use an averaged price index of a basket of certain goods. So if you purchase goods included in the basket, you will notice that you pay 6% more, otherwise not necessarily.
Good day
How do I calculate this question: C= 100+5yd G= 2000 T= 2000 I(planned)=200.
Suppose the actual output is 3000. What is the level of planned expenditures at this level of output?
I am Camara from Guinea west Africa... happy to meet you guys here
Sekou
ma management ho
Amisha
ahile becheclor ho
Amisha
hjr ktm bta ho
ani k kaam grnu hunxa tw
Amisha
belatari
Amisha
1st year ho
Amisha
nd u
Amisha
ahh
Amisha
kaha biratnagar
Amisha
ys
Amisha
kina k vo
Amisha
money as unit of account means what?
Kalombe
A unit of account is something that can be used to value goods and services and make calculations
Jim
all of you please speak in English I can't understand you're language
Muhammad
I want to know how can we define macroeconomics in one line
Muhammad
it must be .9 or 0.9
no Mpc is greater than 1
Y=100+.9Y+50
Y-.9Y=150
0.1Y/0.1=150/0.1
Y=1500
Kalombe
Mercy is it clear?😋
Kalombe
hi can someone help me on this question
If a negative shocks shifts the IS curve to the left, what type of policy do you suggest so as to stabilize the level of output?
discuss your answer using appropriate graph.