<< Chapter < Page Chapter >> Page >

Simple harmonic motion

A type of motion described as simple harmonic motion    involves a restoring force but assumes that the motion will continue forever. Imagine a weighted object hanging on a spring, When that object is not disturbed, we say that the object is at rest, or in equilibrium. If the object is pulled down and then released, the force of the spring pulls the object back toward equilibrium and harmonic motion begins. The restoring force is directly proportional to the displacement of the object from its equilibrium point. When t = 0 , d = 0.

Simple harmonic motion

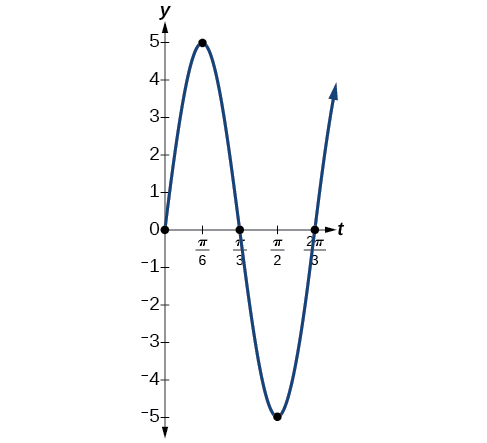
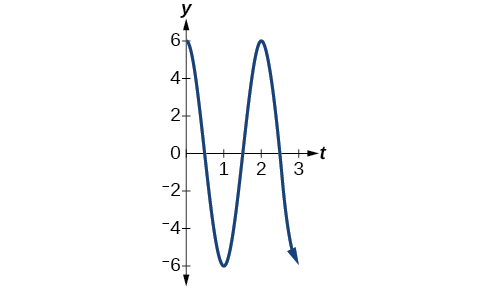
We see that simple harmonic motion    equations are given in terms of displacement:

d = a cos ( ω t )   or   d = a sin ( ω t )

where | a | is the amplitude, 2 π ω is the period, and ω 2 π is the frequency, or the number of cycles per unit of time.

Finding the displacement, period, and frequency, and graphing a function

For the given functions,

  1. Find the maximum displacement of an object.
  2. Find the period or the time required for one vibration.
  3. Find the frequency.
  4. Sketch the graph.
    1. y = 5 sin ( 3 t )
    2. y = 6 cos ( π t )
    3. y = 5 cos ( π 2 t )
  1. y = 5 sin ( 3 t )
    1. The maximum displacement is equal to the amplitude, | a | , which is 5.
    2. The period is 2 π ω = 2 π 3 .
    3. The frequency is given as ω 2 π = 3 2 π .
    4. See [link] . The graph indicates the five key points.
      Graph of the function y=5sin(3t) from 0 to 2pi/3. The five key points are (0,0), (pi/6, 5), (pi/3, 0), (pi/2, -5), (2pi/3, 0).
  2. y = 6 cos ( π t )
    1. The maximum displacement is 6.
    2. The period is 2 π ω = 2 π π = 2.
    3. The frequency is ω 2 π = π 2 π = 1 2 .
    4. See [link] .
      Graph of the function y=6cos(pi t) from 0 to 3.
  3. y = 5 cos ( π 2 ) t
    1. The maximum displacement is 5.
    2. The period is 2 π ω = 2 π π 2 = 4.
    3. The frequency is 1 4 .
    4. See [link] .
      Graph of the function y=5cos(pi/2 t) from 0 to 4.
Got questions? Get instant answers now!

Damped harmonic motion

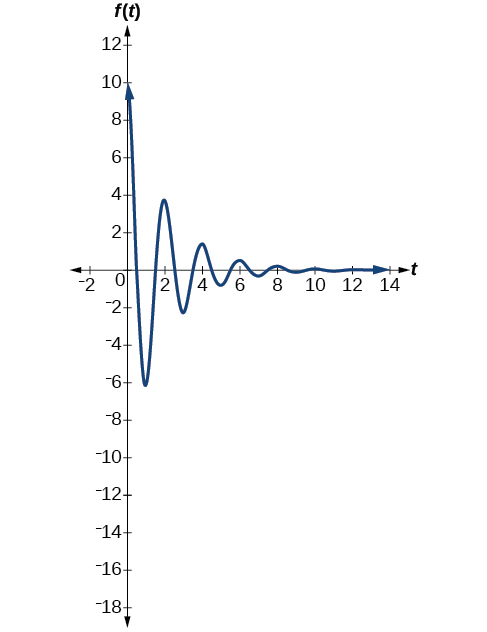
In reality, a pendulum does not swing back and forth forever, nor does an object on a spring bounce up and down forever. Eventually, the pendulum stops swinging and the object stops bouncing and both return to equilibrium. Periodic motion in which an energy-dissipating force, or damping factor, acts is known as damped harmonic motion    . Friction is typically the damping factor.

In physics, various formulas are used to account for the damping factor on the moving object. Some of these are calculus-based formulas that involve derivatives. For our purposes, we will use formulas for basic damped harmonic motion models.

Damped harmonic motion

In damped harmonic motion    , the displacement of an oscillating object from its rest position at time t is given as

f ( t ) = a e c t sin ( ω t ) or   f ( t ) = a e c t cos ( ω t )

where c is a damping factor, | a | is the initial displacement and 2 π ω is the period.

Modeling damped harmonic motion

Model the equations that fit the two scenarios and use a graphing utility to graph the functions: Two mass-spring systems exhibit damped harmonic motion at a frequency of 0.5 cycles per second. Both have an initial displacement of 10 cm. The first has a damping factor of 0.5 and the second has a damping factor of 0.1.

At time t = 0 , the displacement is the maximum of 10 cm, which calls for the cosine function. The cosine function will apply to both models.

We are given the frequency f = ω 2 π of 0.5 cycles per second. Thus,

   ω 2 π = 0.5      ω = ( 0.5 ) 2 π         = π

The first spring system has a damping factor of c = 0.5. Following the general model for damped harmonic motion, we have

f ( t ) = 10 e 0.5 t cos ( π t )

[link] models the motion of the first spring system.

Graph of the first spring system, f(t) = 10(e^(-.5t))cos(pi*t), which begins with a high amplitude and quickly decreases.

The second spring system has a damping factor of c = 0.1 and can be modeled as

f ( t ) = 10 e 0.1 t cos ( π t )

[link] models the motion of the second spring system.

Graph of f(t) = 10(e^(-.1t))cos(pi*t), which begins with a high amplitude and slowly decreases (but has a high frequency).
Got questions? Get instant answers now!

Questions & Answers

Ayele, K., 2003. Introductory Economics, 3rd ed., Addis Ababa.
Widad Reply
can you send the book attached ?
Ariel
?
Ariel
What is economics
Widad Reply
the study of how humans make choices under conditions of scarcity
AI-Robot
U(x,y) = (x×y)1/2 find mu of x for y
Desalegn Reply
U(x,y) = (x×y)1/2 find mu of x for y
Desalegn
what is ecnomics
Jan Reply
this is the study of how the society manages it's scarce resources
Belonwu
what is macroeconomic
John Reply
macroeconomic is the branch of economics which studies actions, scale, activities and behaviour of the aggregate economy as a whole.
husaini
etc
husaini
difference between firm and industry
husaini Reply
what's the difference between a firm and an industry
Abdul
firm is the unit which transform inputs to output where as industry contain combination of firms with similar production 😅😅
Abdulraufu
Suppose the demand function that a firm faces shifted from Qd  120 3P to Qd  90  3P and the supply function has shifted from QS  20  2P to QS 10  2P . a) Find the effect of this change on price and quantity. b) Which of the changes in demand and supply is higher?
Toofiq Reply
explain standard reason why economic is a science
innocent Reply
factors influencing supply
Petrus Reply
what is economic.
Milan Reply
scares means__________________ends resources. unlimited
Jan
economics is a science that studies human behaviour as a relationship b/w ends and scares means which have alternative uses
Jan
calculate the profit maximizing for demand and supply
Zarshad Reply
Why qualify 28 supplies
Milan
what are explicit costs
Nomsa Reply
out-of-pocket costs for a firm, for example, payments for wages and salaries, rent, or materials
AI-Robot
concepts of supply in microeconomics
David Reply
economic overview notes
Amahle Reply
identify a demand and a supply curve
Salome Reply
i don't know
Parul
there's a difference
Aryan
Demand curve shows that how supply and others conditions affect on demand of a particular thing and what percent demand increase whith increase of supply of goods
Israr
Hi Sir please how do u calculate Cross elastic demand and income elastic demand?
Abari
Got questions? Join the online conversation and get instant answers!
Jobilize.com Reply
Practice Key Terms 2

Get Jobilize Job Search Mobile App in your pocket Now!

Get it on Google Play Download on the App Store Now


Source:  OpenStax, Precalculus. OpenStax CNX. Jan 19, 2016 Download for free at https://legacy.cnx.org/content/col11667/1.6
Google Play and the Google Play logo are trademarks of Google Inc.

Notification Switch

Would you like to follow the 'Precalculus' conversation and receive update notifications?

Ask