-
Home
- Precalculus
- Trigonometric identities and
- Modeling with trigonometric
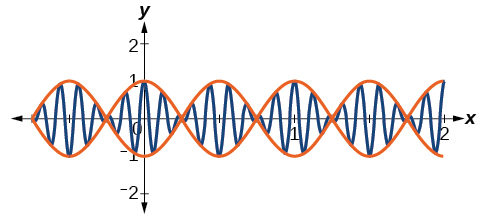
Bounding curves in harmonic motion
Harmonic motion graphs may be enclosed by bounding curves. When a function has a varying
amplitude , such that the amplitude rises and falls multiple times within a period, we can determine the bounding curves from part of the function.
Visit
this website for additional practice questions from Learningpod.
Key equations
| Standard form of sinusoidal equation |
|
| Simple harmonic motion |
|
| Damped harmonic motion |
|
Key concepts
- Sinusoidal functions are represented by the sine and cosine graphs. In standard form, we can find the amplitude, period, and horizontal and vertical shifts. See
[link] and
[link] .
- Use key points to graph a sinusoidal function. The five key points include the minimum and maximum values and the midline values. See
[link] .
- Periodic functions can model events that reoccur in set cycles, like the phases of the moon, the hands on a clock, and the seasons in a year. See
[link] ,
[link] ,
[link] and
[link] .
- Harmonic motion functions are modeled from given data. Similar to periodic motion applications, harmonic motion requires a restoring force. Examples include gravitational force and spring motion activated by weight. See
[link] .
- Damped harmonic motion is a form of periodic behavior affected by a damping factor. Energy dissipating factors, like friction, cause the displacement of the object to shrink. See
[link] ,
[link] ,
[link] ,
[link] , and
[link] .
- Bounding curves delineate the graph of harmonic motion with variable maximum and minimum values. See
[link] .
Section exercises
Verbal
Explain what types of physical phenomena are best modeled by sinusoidal functions. What are the characteristics necessary?
Physical behavior should be periodic, or cyclical.
Got questions? Get instant answers now!
What information is necessary to construct a trigonometric model of daily temperature? Give examples of two different sets of information that would enable modeling with an equation.
Got questions? Get instant answers now!
If we want to model cumulative rainfall over the course of a year, would a sinusoidal function be a good model? Why or why not?
Since cumulative rainfall is always increasing, a sinusoidal function would not be ideal here.
Got questions? Get instant answers now!
Algebraic
For the following exercises, find a possible formula for the trigonometric function represented by the given table of values.
Questions & Answers
differentiate between demand and supply
giving examples
differentiated between demand and supply using examples
Lambiv
how is the graph works?I don't fully understand
hi guys good evening to all
Lambiv
In economics, a perfect market refers to a theoretical construct where all participants have perfect information, goods are homogenous, there are no barriers to entry or exit, and prices are determined solely by supply and demand. It's an idealized model used for analysis,
Ezea
other things being equal
AI-Robot
When MP₁ becomes negative, TP start to decline.
Extuples Suppose that the short-run production function of certain cut-flower firm is given by: Q=4KL-0.6K2 - 0.112 •
Where is quantity of cut flower produced, I is labour input and K is fixed capital input (K-5). Determine the average product of lab
Kelo
Extuples Suppose that the short-run production function of certain cut-flower firm is given by: Q=4KL-0.6K2 - 0.112 •
Where is quantity of cut flower produced, I is labour input and K is fixed capital input (K-5). Determine the average product of labour (APL) and marginal product of labour (MPL)
Kelo
Can I ask you other question?
Shukri
What is different between quantity demand and demand?
Quantity demanded refers to the specific amount of a good or service that consumers are willing and able to purchase at a give price and within a specific time period. Demand, on the other hand, is a broader concept that encompasses the entire relationship between price and quantity demanded
Ezea
how do you save a country economic situation when it's falling apart
what is the difference between economic growth and development
Economic growth as an increase in the production and consumption of goods and services within an economy.but
Economic development as a broader concept that encompasses not only economic growth but also social & human well being.
Shukri
production function means
Jabir
What do you think is more important to focus on when considering inequality ?
any question about economics?
sir...I just want to ask one question... Define the term contract curve? if you are free please help me to find this answer 🙏
Asui
it is a curve that we get after connecting the pareto optimal combinations of two consumers after their mutually beneficial trade offs
Awais
thank you so much 👍 sir
Asui
In economics, the contract curve refers to the set of points in an Edgeworth box diagram where both parties involved in a trade cannot be made better off without making one of them worse off. It represents the Pareto efficient allocations of goods between two individuals or entities, where neither p
Cornelius
In economics, the contract curve refers to the set of points in an Edgeworth box diagram where both parties involved in a trade cannot be made better off without making one of them worse off. It represents the Pareto efficient allocations of goods between two individuals or entities,
Cornelius
Suppose a consumer consuming two commodities X and Y has
The following utility function u=X0.4 Y0.6. If the price of the X and Y are 2 and 3 respectively and income Constraint is birr 50.
A,Calculate quantities of x and y which maximize utility.
B,Calculate value of Lagrange multiplier.
C,Calculate quantities of X and Y consumed with a given price.
D,alculate optimum level of output .
the market for lemon has 10 potential consumers, each having an individual demand curve p=101-10Qi, where p is price in dollar's per cup and Qi is the number of cups demanded per week by the i th consumer.Find the market demand curve using algebra. Draw an individual demand curve and the market dema
suppose the production function is given by ( L, K)=L¼K¾.assuming capital is fixed find APL and MPL. consider the following short run production function:Q=6L²-0.4L³ a) find the value of L that maximizes output b)find the value of L that maximizes marginal product
Abdureman
What is the difference between perfect competition and monopolistic competition?
Mohammed
Got questions? Join the online conversation and get instant answers!
Source:
OpenStax, Precalculus. OpenStax CNX. Jan 19, 2016 Download for free at https://legacy.cnx.org/content/col11667/1.6
Google Play and the Google Play logo are trademarks of Google Inc.