<< Chapter < Page Chapter >> Page >

Finding the amplitude and period of a function

Find the amplitude and period of the following functions and graph one cycle.

  1. y = 2 sin ( 1 4 x )
  2. y = −3 sin ( 2 x + π 2 )
  3. y = cos x + 3

We will solve these problems according to the models.

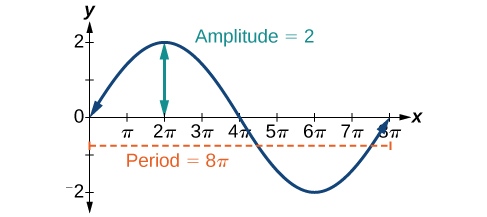
  1. y = 2 sin ( 1 4 x )   involves sine, so we use the form
    y = A sin ( B t + C ) + D

    We know that   | A |   is the amplitude, so the amplitude is 2. Period is   2 π B , so the period is

    2 π B = 2 π 1 4       = 8 π

    See the graph in [link] .

    Graph of y=2sin(1/4 x) from 0 to 8pi, which is one cycle. The amplitude is 2, and the period is 8pi.
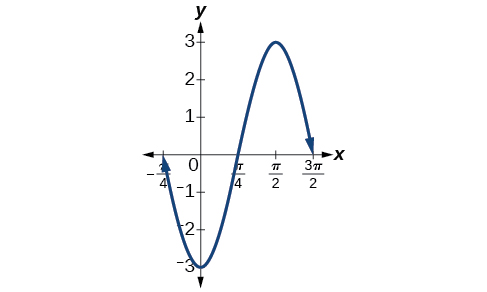
  2. y = −3 sin ( 2 x + π 2 )   involves sine, so we use the form
    y = A sin ( B t C ) + D

    Amplitude is   | A | , so the amplitude is   | 3 | = 3. Since   A   is negative, the graph is reflected over the x -axis. Period is   2 π B , so the period is

    2 π B = 2 π 2 = π

    The graph is shifted to the left by   C B = π 2 2 = π 4   units. See [link] .

    Graph of y=-3sin(2x+pi/2) from -pi/4 to 3pi/2, one cycle. The amplitude is 3, and the period is pi.
  3. y = cos x + 3   involves cosine, so we use the form
    y = A cos ( B t ± C ) + D

    Amplitude is   | A | ,   so the amplitude is 1. The period is   2 π .   See [link] . This is the standard cosine function shifted up three units.
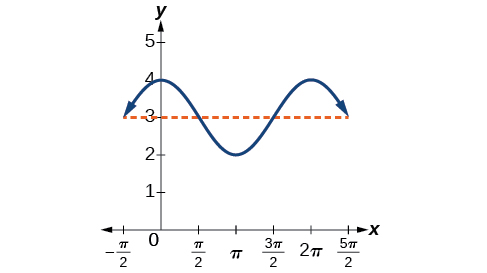
    Graph of y=cos(x) + 3 from -pi/2 to 5pi/2. The amplitude and period are the same as the normal y=cos(x), but the whole graph is shifted up on the y-axis by 3.
Got questions? Get instant answers now!

What are the amplitude and period of the function   y = 3 cos ( 3 π x ) ?

The amplitude is   3 , and the period is   2 3 .

Got questions? Get instant answers now!

Finding equations and graphing sinusoidal functions

One method of graphing sinusoidal functions is to find five key points. These points will correspond to intervals of equal length representing   1 4   of the period. The key points will indicate the location of maximum and minimum values. If there is no vertical shift, they will also indicate x -intercepts. For example, suppose we want to graph the function   y = cos θ . We know that the period is 2 π , so we find the interval between key points as follows.

2 π 4 = π 2

Starting with   θ = 0 , we calculate the first y- value, add the length of the interval   π 2   to 0, and calculate the second y -value. We then add   π 2   repeatedly until the five key points are determined. The last value should equal the first value, as the calculations cover one full period. Making a table similar to [link] , we can see these key points clearly on the graph shown in [link] .
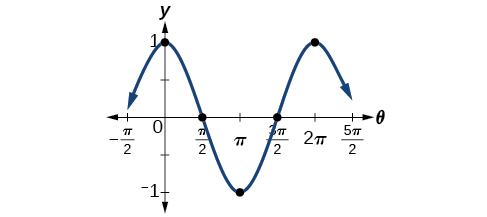
θ 0 π 2 π 3 π 2 2 π
y = cos θ 1 0 −1 0 1
Graph of y=cos(x) from -pi/2 to 5pi/2.

Graphing sinusoidal functions using key points

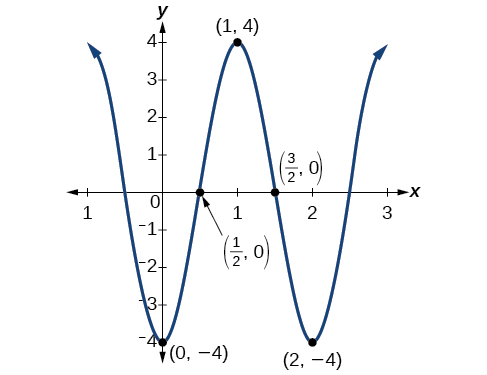
Graph the function   y = −4 cos ( π x )   using amplitude, period, and key points.

The amplitude is   | 4 | = 4.   The period is   2 π ω = 2 π π = 2.   (Recall that we sometimes refer to   B   as   ω . )   One cycle of the graph can be drawn over the interval   [ 0 , 2 ] .   To find the key points, we divide the period by 4. Make a table similar to [link] , starting with   x = 0   and then adding   1 2   successively to   x   and calculate   y .   See the graph in [link] .

x 0 1 2 1 3 2 2
y = −4 cos ( π x ) −4 0 4 0 −4
Graph of y=-4cos(pi*x) using the five key points: intervals of equal length representing 1/4 of the period. Here, the points are at 0, 1/2, 1, 3/2, and 2.
Got questions? Get instant answers now!

Graph the function   y = 3 sin ( 3 x )   using the amplitude, period, and five key points.

x 3 sin ( 3 x )
0 0
π 6 3
π 3 0
π 2 −3
2 π 3 0
Graph of y=3sin(3x) using the five key points: intervals of equal length representing 1/4 of the period. Here, the points are at 0, pi/6, pi/3, pi/2, and 2pi/3.
Got questions? Get instant answers now!

Modeling periodic behavior

We will now apply these ideas to problems involving periodic behavior.

Modeling an equation and sketching a sinusoidal graph to fit criteria

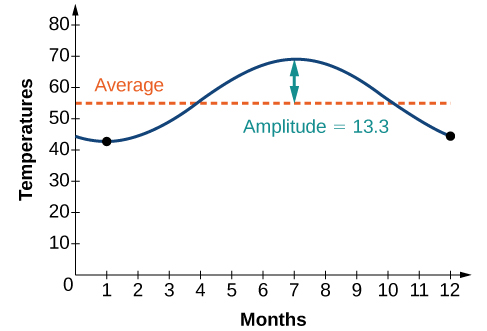
The average monthly temperatures for a small town in Oregon are given in [link] . Find a sinusoidal function of the form y = A sin ( B t C ) + D that fits the data (round to the nearest tenth) and sketch the graph.

Month Temperature, o F
January 42.5
February 44.5
March 48.5
April 52.5
May 58
June 63
July 68.5
August 69
September 64.5
October 55.5
November 46.5
December 43.5

Recall that amplitude is found using the formula

A = largest value  smallest value 2

Thus, the amplitude is

| A | = 69 42.5 2      = 13.25

The data covers a period of 12 months, so 2 π B = 12 which gives B = 2 π 12 = π 6 .

The vertical shift is found using the following equation.

D = highest value + lowest value 2


Thus, the vertical shift is

D = 69 + 42.5 2     = 55.8

So far, we have the equation y = 13.3 sin ( π 6 x C ) + 55.8.

To find the horizontal shift, we input the x and y values for the first month and solve for C .

    42.5 = 13.3 sin ( π 6 ( 1 ) C ) + 55.8 13.3 = 13.3 sin ( π 6 C )      1 = sin ( π 6 C ) sin θ = 1 θ = π 2 π 6 C = π 2 π 6 + π 2 = C            = 2 π 3

We have the equation y = 13.3 sin ( π 6 x 2 π 3 ) + 55.8. See the graph in [link] .

Graph of the equation y=13.3sin(pi/6 x - 2pi/3) + 55.8. The average value is a dotted horizontal line y=55.8, and the amplitude is 13.3
Got questions? Get instant answers now!

Questions & Answers

summarize halerambos & holbon
David Reply
the Three stages of Auguste Comte
Clementina Reply
what are agents of socialization
Antonio Reply
sociology of education
Nuhu Reply
definition of sociology of education
Nuhu
what is culture
Abdulrahim Reply
shared beliefs, values, and practices
AI-Robot
What are the two type of scientific method
ogunniran Reply
I'm willing to join you
Aceng Reply
what are the scientific method of sociology
Man
what is socialization
ogunniran Reply
the process wherein people come to understand societal norms and expectations, to accept society's beliefs, and to be aware of societal values
AI-Robot
scientific method in doing research
ogunniran
defimition of sickness in afica
Anita
Cosmology
ogunniran
Hmmm
ogunniran
list and explain the terms that found in society
REMMY Reply
list and explain the terms that found in society
Mukhtar
what are the agents of socialization
Antonio
Family Peer group Institution
Abdulwajud
I mean the definition
Antonio
ways of perceived deviance indifferent society
Naomi Reply
reasons of joining groups
SAM
to bring development to the nation at large
Hyellafiya
entails of consultative and consensus building from others
Gadama
World first Sociologist?
Abu
What is evolutionary model
Muhammad Reply
Evolution models refer to mathematical and computational representations of the processes involved in biological evolution. These models aim to simulate and understand how species change over time through mechanisms such as natural selection, genetic drift, and mutation. Evolutionary models can be u
faruk
what are the modern trends in religious behaviours
Selekeye Reply
what are social norms
Daniel Reply
shared standards of acceptable behavior by the group or appropriate behavior in a particular institution or those behaviors that are acceptable in a society
Lucius
that is how i understood it
Lucius
examples of societal norms
Diamond
Discuss the characteristics of the research located within positivist and the interpretivist paradigm
Tariro Reply
what is Industrialisation
Selekeye Reply
industrialization
Angelo
Got questions? Join the online conversation and get instant answers!
Jobilize.com Reply
Practice Key Terms 2

Get Jobilize Job Search Mobile App in your pocket Now!

Get it on Google Play Download on the App Store Now


Source:  OpenStax, Precalculus. OpenStax CNX. Jan 19, 2016 Download for free at https://legacy.cnx.org/content/col11667/1.6
Google Play and the Google Play logo are trademarks of Google Inc.

Notification Switch

Would you like to follow the 'Precalculus' conversation and receive update notifications?

Ask