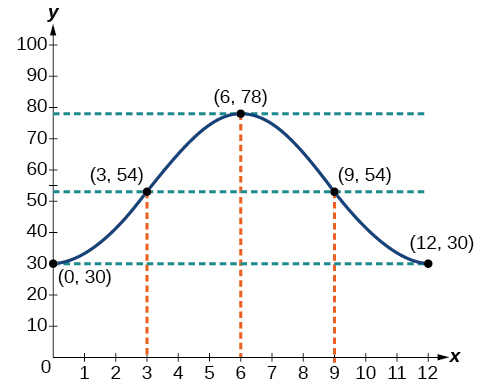
The hour hand of the large clock on the wall in Union Station measures 24 inches in length. At noon, the tip of the hour hand is 30 inches from the ceiling. At 3 PM, the tip is 54 inches from the ceiling, and at 6 PM, 78 inches. At 9 PM, it is again 54 inches from the ceiling, and at midnight, the tip of the hour hand returns to its original position 30 inches from the ceiling. Let
equal the distance from the tip of the hour hand to the ceiling
hours after noon. Find the equation that models the motion of the clock and sketch the graph.
Begin by making a table of values as shown in
[link] .
Points to plot
Noon
30 in
3 PM
54 in
6 PM
78 in
9 PM
54 in
Midnight
30 in
To model an equation, we first need to find the amplitude.
The clock’s cycle repeats every 12 hours. Thus,
The vertical shift is
There is no horizontal shift, so
Since the function begins with the minimum value of
when
(as opposed to the maximum value), we will use the cosine function with the negative value for
In the form
the equation is
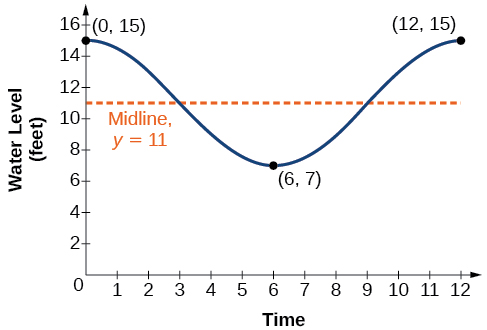
The height of the tide in a small beach town is measured along a seawall. Water levels oscillate between 7 feet at low tide and 15 feet at high tide. On a particular day, low tide occurred at 6 AM and high tide occurred at noon. Approximately every 12 hours, the cycle repeats. Find an equation to model the water levels.
As the water level varies from 7 ft to 15 ft, we can calculate the amplitude as
The cycle repeats every 12 hours; therefore,
is
There is a vertical translation of
Since the value of the function is at a maximum at
we will use the cosine function, with the positive value for
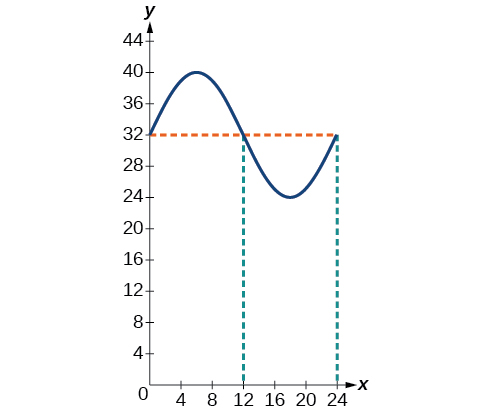
The daily temperature in the month of March in a certain city varies from a low of
to a high of
Find a sinusoidal function to model daily temperature and sketch the graph. Approximate the time when the temperature reaches the freezing point
Let
correspond to noon.
The temperature reaches freezing at noon and at midnight.
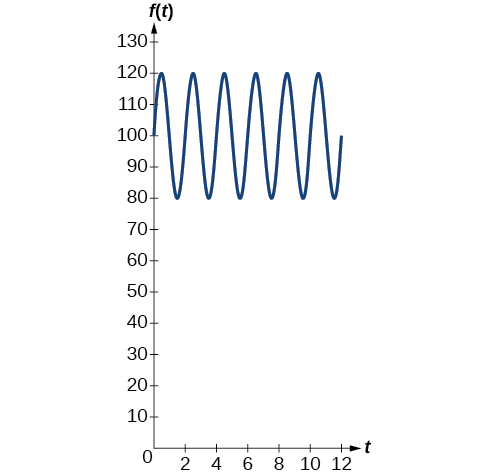
The average person’s blood pressure is modeled by the function
where
represents the blood pressure at time
measured in minutes. Interpret the function in terms of period and frequency. Sketch the graph and find the blood pressure reading.
The period is given by
In a blood pressure function, frequency represents the number of heart beats per minute. Frequency is the reciprocal of period and is given by
Harmonic motion is a form of periodic motion, but there are factors to consider that differentiate the two types. While general
periodic motion applications cycle through their periods with no outside interference,
harmonic motion requires a restoring force. Examples of harmonic motion include springs, gravitational force, and magnetic force.
Questions & Answers
differentiate between demand and supply
giving examples
In economics, a perfect market refers to a theoretical construct where all participants have perfect information, goods are homogenous, there are no barriers to entry or exit, and prices are determined solely by supply and demand. It's an idealized model used for analysis,
When MP₁ becomes negative, TP start to decline.
Extuples Suppose that the short-run production function of certain cut-flower firm is given by: Q=4KL-0.6K2 - 0.112 •
Where is quantity of cut flower produced, I is labour input and K is fixed capital input (K-5). Determine the average product of lab
Kelo
Extuples Suppose that the short-run production function of certain cut-flower firm is given by: Q=4KL-0.6K2 - 0.112 •
Where is quantity of cut flower produced, I is labour input and K is fixed capital input (K-5). Determine the average product of labour (APL) and marginal product of labour (MPL)
Quantity demanded refers to the specific amount of a good or service that consumers are willing and able to purchase at a give price and within a specific time period. Demand, on the other hand, is a broader concept that encompasses the entire relationship between price and quantity demanded
Ezea
ok
Shukri
how do you save a country economic situation when it's falling apart
Economic growth as an increase in the production and consumption of goods and services within an economy.but
Economic development as a broader concept that encompasses not only economic growth but also social & human well being.
Shukri
production function means
Jabir
What do you think is more important to focus on when considering inequality ?
sir...I just want to ask one question... Define the term contract curve? if you are free please help me to find this answer 🙏
Asui
it is a curve that we get after connecting the pareto optimal combinations of two consumers after their mutually beneficial trade offs
Awais
thank you so much 👍 sir
Asui
In economics, the contract curve refers to the set of points in an Edgeworth box diagram where both parties involved in a trade cannot be made better off without making one of them worse off. It represents the Pareto efficient allocations of goods between two individuals or entities, where neither p
Cornelius
In economics, the contract curve refers to the set of points in an Edgeworth box diagram where both parties involved in a trade cannot be made better off without making one of them worse off. It represents the Pareto efficient allocations of goods between two individuals or entities,
Cornelius
Suppose a consumer consuming two commodities X and Y has
The following utility function u=X0.4 Y0.6. If the price of the X and Y are 2 and 3 respectively and income Constraint is birr 50.
A,Calculate quantities of x and y which maximize utility.
B,Calculate value of Lagrange multiplier.
C,Calculate quantities of X and Y consumed with a given price.
D,alculate optimum level of output .
the market for lemon has 10 potential consumers, each having an individual demand curve p=101-10Qi, where p is price in dollar's per cup and Qi is the number of cups demanded per week by the i th consumer.Find the market demand curve using algebra. Draw an individual demand curve and the market dema
suppose the production function is given by ( L, K)=L¼K¾.assuming capital is fixed find APL and MPL. consider the following short run production function:Q=6L²-0.4L³ a) find the value of L that maximizes output b)find the value of L that maximizes marginal product