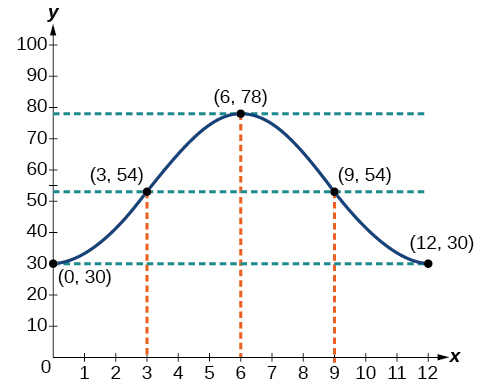
The hour hand of the large clock on the wall in Union Station measures 24 inches in length. At noon, the tip of the hour hand is 30 inches from the ceiling. At 3 PM, the tip is 54 inches from the ceiling, and at 6 PM, 78 inches. At 9 PM, it is again 54 inches from the ceiling, and at midnight, the tip of the hour hand returns to its original position 30 inches from the ceiling. Let
equal the distance from the tip of the hour hand to the ceiling
hours after noon. Find the equation that models the motion of the clock and sketch the graph.
Begin by making a table of values as shown in
[link] .
Points to plot
Noon
30 in
3 PM
54 in
6 PM
78 in
9 PM
54 in
Midnight
30 in
To model an equation, we first need to find the amplitude.
The clock’s cycle repeats every 12 hours. Thus,
The vertical shift is
There is no horizontal shift, so
Since the function begins with the minimum value of
when
(as opposed to the maximum value), we will use the cosine function with the negative value for
In the form
the equation is
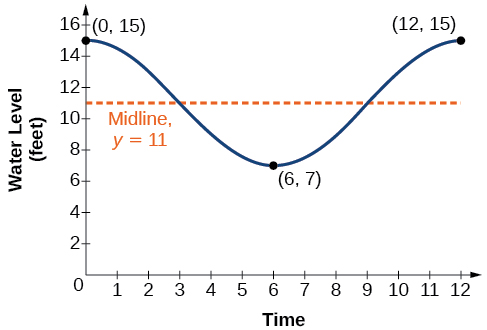
The height of the tide in a small beach town is measured along a seawall. Water levels oscillate between 7 feet at low tide and 15 feet at high tide. On a particular day, low tide occurred at 6 AM and high tide occurred at noon. Approximately every 12 hours, the cycle repeats. Find an equation to model the water levels.
As the water level varies from 7 ft to 15 ft, we can calculate the amplitude as
The cycle repeats every 12 hours; therefore,
is
There is a vertical translation of
Since the value of the function is at a maximum at
we will use the cosine function, with the positive value for
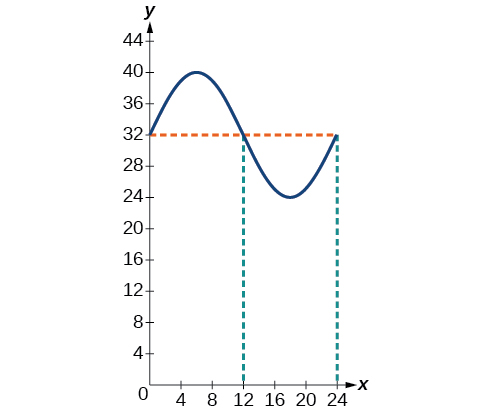
The daily temperature in the month of March in a certain city varies from a low of
to a high of
Find a sinusoidal function to model daily temperature and sketch the graph. Approximate the time when the temperature reaches the freezing point
Let
correspond to noon.
The temperature reaches freezing at noon and at midnight.
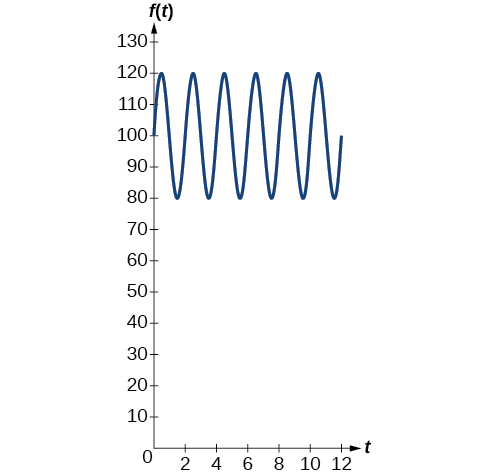
The average person’s blood pressure is modeled by the function
where
represents the blood pressure at time
measured in minutes. Interpret the function in terms of period and frequency. Sketch the graph and find the blood pressure reading.
The period is given by
In a blood pressure function, frequency represents the number of heart beats per minute. Frequency is the reciprocal of period and is given by
Harmonic motion is a form of periodic motion, but there are factors to consider that differentiate the two types. While general
periodic motion applications cycle through their periods with no outside interference,
harmonic motion requires a restoring force. Examples of harmonic motion include springs, gravitational force, and magnetic force.
Questions & Answers
Ayele, K., 2003. Introductory Economics, 3rd ed., Addis Ababa.
what's the difference between a firm and an industry
Abdul
firm is the unit which transform inputs to output where as industry contain combination of firms with similar production 😅😅
Abdulraufu
Suppose the demand function that a firm faces shifted from
Qd 120 3P
to
Qd 90 3P
and the supply function has shifted from
QS
20 2P
to
QS
10 2P .
a) Find the effect of this change on price and quantity.
b) Which of the changes in demand and supply is higher?
Demand curve shows that how supply and others conditions affect on demand of a particular thing and what percent demand increase whith increase of supply of goods
Israr
Hi Sir please how do u calculate Cross elastic demand and income elastic demand?
Abari
Got questions? Join the online conversation and get instant answers!