-
Home
- Precalculus
- Trigonometric identities and
- Modeling with trigonometric
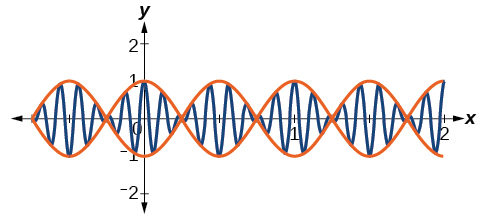
Bounding curves in harmonic motion
Harmonic motion graphs may be enclosed by bounding curves. When a function has a varying
amplitude , such that the amplitude rises and falls multiple times within a period, we can determine the bounding curves from part of the function.
Visit
this website for additional practice questions from Learningpod.
Key equations
| Standard form of sinusoidal equation |
|
| Simple harmonic motion |
|
| Damped harmonic motion |
|
Key concepts
- Sinusoidal functions are represented by the sine and cosine graphs. In standard form, we can find the amplitude, period, and horizontal and vertical shifts. See
[link] and
[link] .
- Use key points to graph a sinusoidal function. The five key points include the minimum and maximum values and the midline values. See
[link] .
- Periodic functions can model events that reoccur in set cycles, like the phases of the moon, the hands on a clock, and the seasons in a year. See
[link] ,
[link] ,
[link] and
[link] .
- Harmonic motion functions are modeled from given data. Similar to periodic motion applications, harmonic motion requires a restoring force. Examples include gravitational force and spring motion activated by weight. See
[link] .
- Damped harmonic motion is a form of periodic behavior affected by a damping factor. Energy dissipating factors, like friction, cause the displacement of the object to shrink. See
[link] ,
[link] ,
[link] ,
[link] , and
[link] .
- Bounding curves delineate the graph of harmonic motion with variable maximum and minimum values. See
[link] .
Section exercises
Verbal
Explain what types of physical phenomena are best modeled by sinusoidal functions. What are the characteristics necessary?
Physical behavior should be periodic, or cyclical.
Got questions? Get instant answers now!
What information is necessary to construct a trigonometric model of daily temperature? Give examples of two different sets of information that would enable modeling with an equation.
Got questions? Get instant answers now!
If we want to model cumulative rainfall over the course of a year, would a sinusoidal function be a good model? Why or why not?
Since cumulative rainfall is always increasing, a sinusoidal function would not be ideal here.
Got questions? Get instant answers now!
Algebraic
For the following exercises, find a possible formula for the trigonometric function represented by the given table of values.
Questions & Answers
number of sport play by 50 student construct discrete data
width of the frangebany leaves on how to write a introduction
Solve the mean of variance
Step 1: Find the mean. To find the mean, add up all the scores, then divide them by the number of scores. ...
Step 2: Find each score's deviation from the mean. ...
Step 3: Square each deviation from the mean. ...
Step 4: Find the sum of squares. ...
Step 5: Divide the sum of squares by n – 1 or N.
kenneth
Is mistake done to something
Vutshila
What is the life teble
anas
statistics is the analyzing of data
how do you calculate mean
diveving the sum if all values
Shaynaynay
let A1,A2 and A3 events be independent,show that (A1)^c, (A2)^c and (A3)^c are independent?
data collected all over the world
Shaynaynay
construct a less than and more than table
The sample of 16 students is taken. The average age in the sample was 22 years with astandard deviation of 6 years. Construct a 95% confidence interval for the age of the population.
Bhartdarshan' is an internet-based travel agency wherein customer can see videos of the cities they plant to visit. The number of hits daily is a normally distributed random variable with a mean of 10,000 and a standard deviation of 2,400
a. what is the probability of getting more than 12,000 hits?
b. what is the probability of getting fewer than 9,000 hits?
Bhartdarshan'is an internet-based travel agency wherein customer can see videos of the cities they plan to visit. The number of hits daily is a normally distributed random variable with a mean of 10,000 and a standard deviation of 2,400.
a. What is the probability of getting more than 12,000 hits
Akshay
Sorry i want to learn more about this question
Bright
a= 0.20233
b=0.3384
Sufiyan
How do I interpret level of significance?
It depends on your business problem or in Machine Learning you could use ROC- AUC cruve to decide the threshold value
Shivam
how skewness and kurtosis are used in statistics
Got questions? Join the online conversation and get instant answers!
Source:
OpenStax, Precalculus. OpenStax CNX. Jan 19, 2016 Download for free at https://legacy.cnx.org/content/col11667/1.6
Google Play and the Google Play logo are trademarks of Google Inc.